
Revista de Ciencias Ambientales (Trop J Environ Sci). (Enero-Junio, 2018). EISSN: 2215-3896. Vol 52(1): 1-26.
DOI: http://dx.doi.org/10.15359/rca.52-1.2
URL: www.revistas.una.ac.cr/ambientales
EMAIL: revista.ambientales@una.cr
Road Encroachment Near Protected Areas Alters the Natural Soundscape Through Traffic Noise Pollution in Costa Rica
La invasión de caminos cerca de las áreas protegidas altera el paisaje natural sonoro debido a la contaminación del ruido por tránsito en Costa Rica
J. Edgardo Arévalo
Professor, Tropical Ecology, The School for Field Studies, Costa Rica; and professor and researcher, School of Biology, University of Costa Rica, Costa Rica. ORCID: 0000-0003-4160-8373, earevalo@fieldstudies.org
Emily Blau
Student, Sustainable Development, SIT Graduate Institute, USA, emily.blau@mail.sit.edu
Received: August 30th, 2017. Accepted: October, 3rd, 2017. Corrected: November 7th, 2017. Published: January, 01st, 2018.
Abstract
Road networks are spatially disposed across landscapes and are differentially used by traffic, generating levels of noise that may negatively affect protected areas. The objective of this study is to quantify the length of road stretches in contact and in close proximity to protected areas, and to investigate differential effects parks may have in relation to traffic volumes and noise pollution. We measured road networks in proximity to protected areas using a geographic information system and the Atlas of Costa Rica. Noise and traffic volumes were quantified in three protected areas with direct adjacency with roads. We generated environmental sound maps to assess the influence of noise on natural sounds, such as those produced by streams (geophony) and birds (biophony). We recorded biophony close and far to the road in one of the protected areas. We found that 70 protected areas are directly or indirectly affected by road proximity. Noise was greater in roads with higher traffic usage than those with lower traffic usage, but the type of vehicles also influenced noise levels. Noise penetrated the forest with greater levels during the dry season than in the wet season. We found that the amount of biophony in seconds was lower close than far from the road, and that the stream sound was masked by traffic noise. Our results suggest that noise may contribute to habitat degradation through a decrease and loss of natural sounds, decreasing the quality of biodiversity protection. Interdisciplinary action and rigorous planning must be considered to avoid road encroachment on protected areas.
Keywords: Anthrophony, biodiversity conservation, biophony, geophony, soundscape conservation, traffic volume.
Resumen
Las carreteras están espacialmente dispuestas en los paisajes y son utilizadas por el tránsito, generando ruido que puede afectar las áreas protegidas. El objetivo fue cuantificar los tramos de carretera, en contacto y en proximidad con áreas, e investigar los efectos que los parques pueden tener en relación con el tránsito y el ruido. Medimos tramos cercanos a las áreas utilizando el sistema de información geográfica y el Atlas de Costa Rica. El ruido y tránsito fueron cuantificados en tres áreas adyacentes a carreteras. Generamos mapas de ruido para evaluar la influencia sobre los sonidos naturales, tales como los de arroyos (geofonía) y aves (biofonía). Grabamos la biofonía cerca y lejos de carretera en una de las áreas. Encontramos que 70 áreas protegidas son afectadas directa o indirectamente por las carreteras. El ruido fue mayor en carreteras con uso vehicular más alto que con uno menor, pero niveles de ruido también fueron influenciados por tipo de vehículo. El ruido penetró el bosque con mayores niveles en la estación seca que en la húmeda. Encontramos que la cantidad de biofonía en segundos fue menor cerca de la carretera y que el sonido del arroyo fue enmascarado por el ruido. Nuestros resultados sugieren que el ruido contribuye a la degradación del hábitat a través de la disminución y pérdida de sonidos naturales, reduciendo la calidad de la protección de la biodiversidad. Se debe considerar una acción interdisciplinaria y una planificación rigurosa para evitar la adyacencia de carreteras sobre las áreas protegidas.
Palabras clave: Antrofonía, biofonía, conservación de la biodiversidad, conservación de paisaje sonoro, geofonía, volumen de tránsito.
1. Introduction
Tropical forests have been the focus of global biodiversity protection over the last 40 years, particularly since the Rio Summit in 1992. The main reasons for this are that tropical forests maintain exceptionally high levels of biodiversity which are being cleared at a fast rate (Arévalo and Ladle, 2016). Deforestation of tropical forest alters the ecosystem function due to habitat loss and fragmentation, further increasing biodiversity loss and habitat degradation (Fahrig, 2003). The setting aside of areas for biodiversity protection, such as national parks, has been the worldwide conservation strategy and has accumulated between 10.1 and 15.5 % of the global area (Chape et al., 2005; Soutullo, 2010). Nonetheless, the effectiveness of this strategy varies greatly country to country and is seriously threatened in tropical areas (Chape et al., 2005). Amongst the main factors currently challenging the effectiveness of protected areas are lack of law enforcement, undefined geographic borders, poaching, illegal clearings and fires (Arévalo and Ladle, 2016). In addition, human infrastructure and land use types on the landscapes may directly or indirectly affect areas set aside for biodiversity protection (Laurence, Goosem and Laurance, 2009).
The landscape composition strongly influences the quality of the ecosystem function in a given protected area. The designated areas for biodiversity protection are embedded in different matrix types, exposing them to a great variety of negative effects. For example, a protected area might be surrounded by coffee farms with shade trees whereas another one might by surrounded by an urban matrix. The latter is expected to induce more negative effects than the former coffee matrix (Rodewald, 2003). This is because urban development is typically composed of a highly dense network of roads that would negatively influence wilderness (Forman et al., 2003).
The road infrastructure on different landscapes has grown approximately by 12 million km in the world since the year 2000 and is expected to increase in the near future (Dulac, 2013). Road networks are generally built in relation to the economic development of most societies, often at the expense of serious environmental harm (Laurence et al., 2015). Road construction and usage produce a variety of negative effects, such as wildlife mortality, habitat loss and fragmentation, exhaust emissions and noise pollution (Forman et al. 2003; Coffin, 2007; Van der Ree, Smith and Grilo, 2015). Anthropogenic noise interferes with many ecological processes in both aquatic and terrestrial species, particularly in those where acoustic communication is important (Shannon et al., 2016).
Landscapes possess a myriad of interacting sounds that constitute the soundscape (Farina, 2014; Payne et al., 2009). The soundscapes of natural habitats, like protected areas, are composed of sounds produced by living organisms, known as the biophony; and sounds produced by nonliving things, the geophony (Farina, 2014). In contrast, noise produced by humans, called anthrophony, can have detrimental effects on a variety of ecological processes among species. For instance, birds change their song structure, such as the frequency at which they sing, to avoid signal masking in noisy roads or cities (Francis, Ortega and Cruz, 2010; Kight and Swaddle, 2015; Potvin, Parris and Mulder, 2011; Slabbekoorn, 2013). This type of noise interference during bird communication may explain a decrease in bird abundance and species richness in some studies (McClure et al., 2013; Proppe, Sturdy and St. Clair, 2013). Road traffic is the most predominant source of noise in many landscapes where protected areas are spatially located, often in close proximity to roads. Thus, incoming noise to the protected habitats is in direct conflict with the quality of biodiversity protection.
According to the Atlas of Costa Rica (TEC, 2014), there are 170 protected areas distributed in the mainland of the country. These areas are under different categories of protection such as national parks, wildlife refuges and protected zones being the most numerous ones. The Costa Rican road network is comprised of approximately 40 000 km of roads, of which about 10 000 km are paved (Transportation National Plan of Costa Rica, 2011). Although there have been some concerns about the effects of roads on wildlife mortality (Arévalo et al., 2017; Monge-Nájera, 1996; Pomareda, 2012; Rojas-Chacón, 2011); there are no studies regarding road proximity, volumes of traffic or the effect of noise in protected areas in Costa Rica, to our knowledge.
Amongst the main goals of protected areas in Costa Rica are the conservation of biodiversity, human recreation and nature education. However, some national parks located near roads receive high levels of traffic noise that interferes with the biophony and geophony within the protected areas. This negatively affects the level of human appreciation for natural sounds and may be detrimental for wildlife in general, as explained above. The objectives of this study were to quantify the length of road stretches in direct contact and in close proximity to protected areas; to assess traffic volumes and noise pollution transmission at different distances from roads in three protected areas; to evaluate differences in noise transmission related to seasonality in two protected areas; and to evaluate natural sounds, such as biophonies, in a protected area with traffic noise.
2. Methods and materials
2.1. Protected areas and road proximity
In order to assess road encroachment in natural protected areas in Costa Rica, we employed QGIS 2.14 (ESSEN) and the Atlas of Costa Rica (TEC, 2014) to measure the length of all primary and secondary roads that either traverse the forest or are adjacent to the border of the protected areas. In addition, we measured the length of primary and secondary roads that are within two kilometers from the border of the protected areas. This distance could be considered to be within the road-effect zone (Forman et al., 2003). The length of this effect zone varies depending on the taxa, size of the infrastructure and traffic volume. We consider 2 km, perpendicular to the protected area limit, to be within the road-effect zone based on the estimated 0.04-2.8 km zone extent that reduces bird densities in Holland (Reijnen et al., 1995). In addition, a study with frogs in Canada by Eigenbrod, Hecnar and (Fahrig, 2009) suggests an ideal distance of 2 km from the road to mitigate negative influence of road-effect zone.
For this analysis, we included all categories of protected areas excluding private reserves since they are generally small in size.
2.2. Focal protected areas
We used the following protected areas as the focal study sites: Carara National Park, Poás Volcano National Park and Santa Rosa National Park (within the Guanacaste Conservation Area in Figure 1). Figure 1 shows the road network and the protected areas in Costa Rica, including the focal study sites for this study. We utilized the Atlas of Costa Rica (TEC, 2014) and Google Earth Pro to obtain the information of the park characteristics.
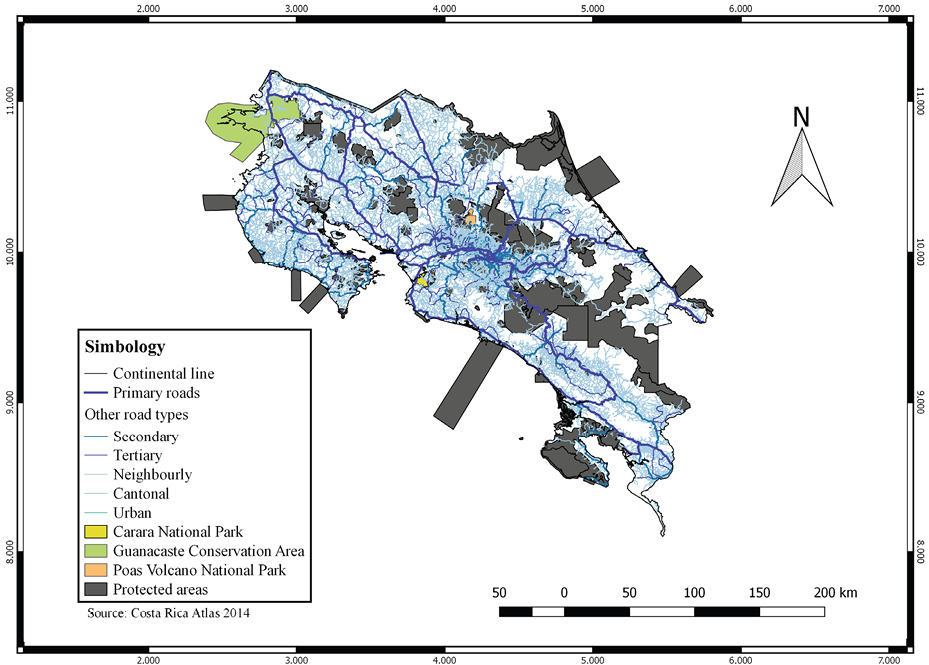
Figure 1. Map of Costa Rica showing the spatial distribution of protected areas, including the focal protected areas analyzed in this study, and the road network. The Guanacaste Conservation Area includes both Santa Rosa and Guanacaste National Park. Map Datum: WGS84; Costa Rican Projection: CRTM05.
2.2.1. Carara National Park
Carara National Park, thereafter referred to as Carara, is located in the central Pacific and comprises both primary and secondary growth of a wet-to-dry transitional forest. Carara protects the only relatively large forest remnant of its kind (5 280 ha), including several habitat types in an altitudinal gradient of 30-600 masl. The national Route 34 limits the border of the park in its lowest altitude range represented by a tropical premontane moist forest basal belt transition (Holdridge, 1966). This forest receives between 2 000 to 3 000 mm of rain mainly in the wet season from May through December while March and April are the driest months. The Route 34 is a two-lane asphalt road that runs along 4 km of the forest edge of the park.
2.2.2. Santa Rosa National Park
Among other protected areas, the Guanacaste Conservation Area includes Santa Rosa and Guanacaste National Parks that are located next to each other. The national Route 1, known as the Inter-American Highway, is an asphalt road with two lanes that bisect the forest of both parks for 13.4 km. Santa Rosa National Park, thereafter referred to as Santa Rosa, protects the remaining and highly endangered tropical dry forest distributed in North Western Costa Rica. The park has a mosaic of old pastures, overgrown vegetation and secondary forest. This forest has a well-marked dry season from mid-November through mid-May, and receives between 1 500 to 2 000 mm a year in the rainy season. The stretch of road that traverses both national parks is found at 250 masl.
2.2.3. Poás Volcano National Park
Poás Volcano National Park, thereafter referred to as Poás, is located in the central volcanic mountain range and protects evergreen forest between 2 400 to 2 708 masl. The study site was located at 2 540 masl, within the tropical lower montane wet forest (Holdridge, 1966). This forest receives between 3 000 to 4 000 mm of rain a year, with frequent moisture input from cloud cover. The park has a two-lane asphalt road that provides access to the visitor center from the park entrance. This road stretch is two km in length and runs along the forest and grassy open areas. Poás received more than 300 000 visitors a year until April 13, 2017, when the park was closed to the public due to dangerous volcanic eruptions.
2.3. Traffic volumes and road noise in the focal protected areas
Over the years, students of the School for Field Studies (Costa Rica), field assistants and the authors collected the data in the focal national parks. We tallied the number of vehicles passing by the road adjacent to the forest of Carara on the following dates: April 19-23 and November 21-28, 2008; April 15-20, June 25-28 and July 30-August 2, 2010; April 12-16, August 1-4 and November 27-December 1, 2012; April 20-25, July 20-August 1 and November 28-December 5, 2015; November 16-22, 2016 and April 20-25, 2017. One-hour counts were conducted once or twice in the mornings (7 to 10 a. m.) and in the afternoons (2 to 4 p. m); and vehicles were classified as “light” (e. g. cars, small trucks, vans) or “heavy” (e. g. big trucks, buses, trailers). We categorized weekdays from Monday through Friday and weekends Saturday and Sunday to evaluate changes in traffic volumes.
We also took 128 measurements of noise at 5 meters from the road in four sites at least 400 m apart along the 4 km of the Carara limit. The noise measurements were taken with a sound level meter DT-8851 at 1.3 meters above the ground, and directed towards the road. All noise measurements included both the minimum and the maximum level measured in decibels. We applied the same protocol to count vehicles and to measure noise levels in Santa Rosa and Poás.
In Santa Rosa, we took 176 noise measurements on April 16-21, 2009 and 150 measurements on November 19-22, 2009, using a sound level meter Extech 407730. We took 510 measurements on April 23-28, 2014 using a sound level meter DT-885. Noise levels were taken in five permanent points spaced 300 meters apart along the Inter-American Highway.
In Poás, we took 659 noise measurements on November 17-22, 2013 using a sound level meter DT-8855. Measurements were taken every 100 m along the two km of the access road.
All the sound level meters used were set in fast mode and calibrated to 94 dB with an acoustic calibrator EXTECH 407744.
2.4. Seasonal assessment of noise transmission through the forest
2.4.1. Santa Rosa
To assess seasonal noise transmission to the inner forest in Santa Rosa, we established five linear transects of 165 m, spaced by 300 m and perpendicular from the road towards the inner forest. Following the same protocol for noise measurements described above, we took minimum and maximum noise level at five meters from the edge of the road, then at 15 m and then every 10 m until a distance of 115 m, taking a final measurement at 165 m from the road in dry season (April, 2009). We repeated the same procedure using four of the same permanent transects in the wet season (November, 2009).
2.4.2. Carara
To assess noise transmission in the forest of Carara, we measured minimum and maximum noise levels at the following distances from the road: 5, 60, 66, 112, 115, 254, 466, 524, 581, 602 and 650 m along the existing park trails. We used these permanent point distances that were being used for the recording of bird sounds (see section 2.6 below). We operated a GPS Garmin eTrex 30 to obtain the coordinates of the points and used the Google Earth tool to calculate the distances between the points and the road. Samples sizes at each sampling point varied depending on time availability. We took a minimum of eight and 57 noise measurements at each point in the dry (April, 2012) and wet (November, 2012) season respectively, except for the distance at five meters on the road. We took 50 and 284 noise measurements at the road point in the dry and wet season, respectively.
2.5. Biophony and environmental sound maps in Carara
2.5.1. Biophony
Biophony is composed of all sounds produced by living organisms. Since bird songs dominate the biophonies during dawn choruses, we used bird sound as a general measure of the biophonies produced in Carara. We utilized automated song meters (Wildlife Acoustic SM2+) programed to record biophonies from 5:00 a. m. to 7:30 a. m. on April 12-16, 2012. The song meters recorded two minutes every three minutes using an omnidirectional microphone placed at 1.5 m above the ground. We employed five permanent points in close proximity to the road, referred to as “close” (60, 66, 112, 115 and 254 m) and five further away, referred to as “far” (466, 524, 581, 602 and 650 m). Biophonies were recorded simultaneously at each close and far point every day for five consecutive days. We utilized sound analysis Raven Pro 1.4 software to measure the amount of time the biophonies occupy in the soundscape from 600 minutes of sound recordings. To obtain the amount of biophony we selected each of the spectral marks of the singing bird species displayed in Raven’s spectrogram and measured the duration in seconds of each sound. We then summed all the sound measurements to obtain the total amount of biophony per location.
2.5.2. Environmental sound maps
We created a grid of 100 m2 with 25 points spaced by 25 m from the road to the inner forest on April 20-25, 2015. The grid was adjacent to the road and included a stream that passed over the road in a perpendicular way. We used string and a compass to layout the 100 x 100 m grid and used a GPS Garmin eTrex 30 to obtain the coordinates of each point in the grid. During the first two days, we took two minimum and two maximum sound level measurements in each point at 9:00 a. m. and resampled the grid at 3:00 p. m. We took three measurements of both minimum and maximum levels in the following three days using the same time schedule. We averaged all sound measurements for each point and imported as a text format file in to QGIS to generate the sound maps. We employed minima and maxima to illustrate the range of environmental sounds in the maps. For this, we employed the spatial tool and the Inverse Distance Weighting method of sound interpolation (Achilleos, 2011).
2.6. Data analysis
We employed R-Project, version 1.0.143 (R Core Team, 2014) to generate the graphics and perform the statistical analysis.
2.6.1. Traffic volumes and road noise in the focal protected areas
We utilized generalized linear model (GLM) to compare the differences in vehicle volumes and noise levels in relation to the following factors: years, vehicles type, day of the week and time of day (factors with very small samples in some parks were not analyzed).
2.6.2. Seasonal assessment of noise transmission through the forest
We analyzed the seasonal levels of noise as a function of distance from the road in Carara and Santa Rosa using the following models: general lineal model (LM), general additive model (GAM) and logarithmic model (LOG). Best model was obtained using the Akaike Information Criterion (AIC), using the samples to correct for small sample sizes (AICc).
2.6.3. Biophony and environmental sound maps
We utilized GLM to compare the amount of biophony close and far from the road in Carara. Environmental sound conditions were qualitatively assessed using sound maps (see methods).
3. Results
3.1. Protected areas and road proximity
A total of 532.52 km of roads were found under the road-effect zone, affecting 70 areas (41.2 % of the total protected areas) in three categories of protection. These categories were national parks, wildlife refuges and protected zones; the latter being the most affected by road proximity, followed by national parks and wildlife refuges (Table 1). Half of the protected zones (16) were within two kilometers from either primary or secondary roads, three were traversed by roads and six had adjacent roads. The length of 282 km influences 80.6 % of all protected zones (Table 1). Likewise, 179 km of roads are in direct contact with other protected areas, national parks being the areas most affected by direct adjacency (Table 1).
Table 1. Categories of protected areas that are directly and indirectly impacted by the spatial disposition of main roads in Costa Rica. The condition “Traverse” bisects the continuous forest of the protected area; the category “Adjacent” limits the border; and “< 2 km” signifies the distance from the road to the border of the protected area in a straight line.
|
Spatial condition of the road |
||||
|
Category of protection |
Traverse |
Adjacent |
< 2 km |
Total km |
|
National park |
77.83 |
54.25 |
67.42 |
199.5 |
|
Wildlife refuge |
2.75 |
3.71 |
44.8 |
51.26 |
|
Protected zone |
7.61 |
32.51 |
241.64 |
281.76 |
|
Total km |
88.19 |
90.47 |
353.86 |
532.52 |
3.2. Traffic volumes and road noise in the focal protected areas
Carara had the highest traffic volume in comparison to Santa Rosa and Poás (Figure 2). However, the range in the number of light and heavy vehicles was highly variable (Table 2). Regarding average size differences, Carara had 208.56 more vehicles per hour than Santa Rosa and 248.11 more vehicles than Poás; differences that are highly significant (F = 254.4, DF = 382, P < 2.2e-16). Traffic volumes did not differ significantly between Santa Rosa and Poás (Tukey test, P = 0.28). The highest number of 326 vehicles in Poás was recorded on a Sunday (Figure 2).
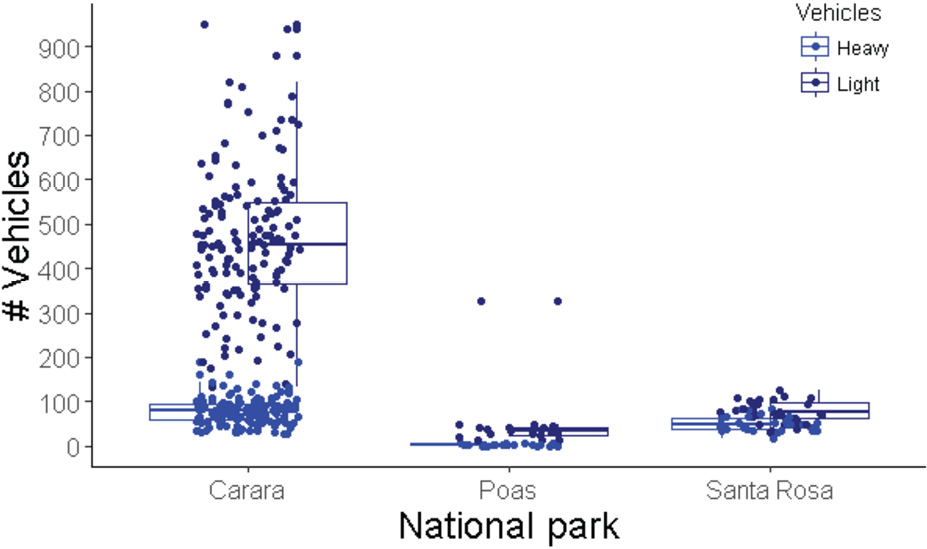
Figure 2. Traffic volumes by vehicle types recorded in the three focal protected areas between 2008 and 2017. Horizontal, box and vertical line show the median, 2nd and 3rd quartile respectively. Scatter shows the actual values.
Table 2. Maximum and Minimum number of vehicles tallied in three national parks, Costa Rica. Max = maximum and Min = minimum.
|
Vehicle volume range National Park |
|||
|
Carara |
Santa Rosa |
Poás |
|
|
Max light |
949 |
125 |
326 |
|
Min light |
132 |
18 |
14 |
|
Max heavy |
187 |
85 |
7 |
|
Min heavy |
27 |
18 |
0 |
There was a significant increase in the number of vehicles from year 2008 to 2017 in Carara (F = 154.2, DF = 278, P < 2.2e-16). This increase is mainly in light vehicles, and it levels off from 2015 to 2017 when there was no significant change (Figure 3, Tukey test P = 0.99). There was an average increase of 133.96 vehicles per hour from 2008 to 2017, and weekends had an average of 32.73 vehicles more compared to weekdays (P = 0.008). Traffic volumes were highly variable for light compared with heavy vehicles (Figure 3).
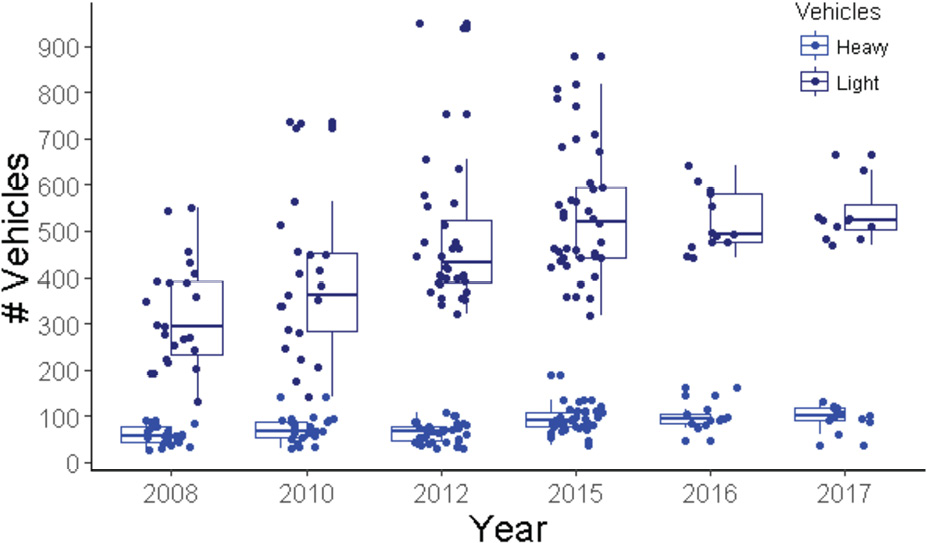
Figure 3. Traffic volumes by vehicle types recorded in Carara National Park between 2008 and 2017. Horizontal, box and vertical line show the median, 2nd and 3rd quartile respectively. Scatter shows the actual values.
There were significant differences in the type of vehicles, day, time of day, and year in the traffic passing by Santa Rosa (F = 14.46, DF = 58, P = 3.797e-07). Like in Carara, light vehicles were more numerous than heavy ones with an average difference of 27.13 (P = 8.67e-07). Unlike Carara, weekends had on average 13.51 vehicles less than weekdays (P = 0.0089); and there was only a marginal increase in the number of heavy vehicles from 2009 and 2014 (Figure 4, P = 0.06).
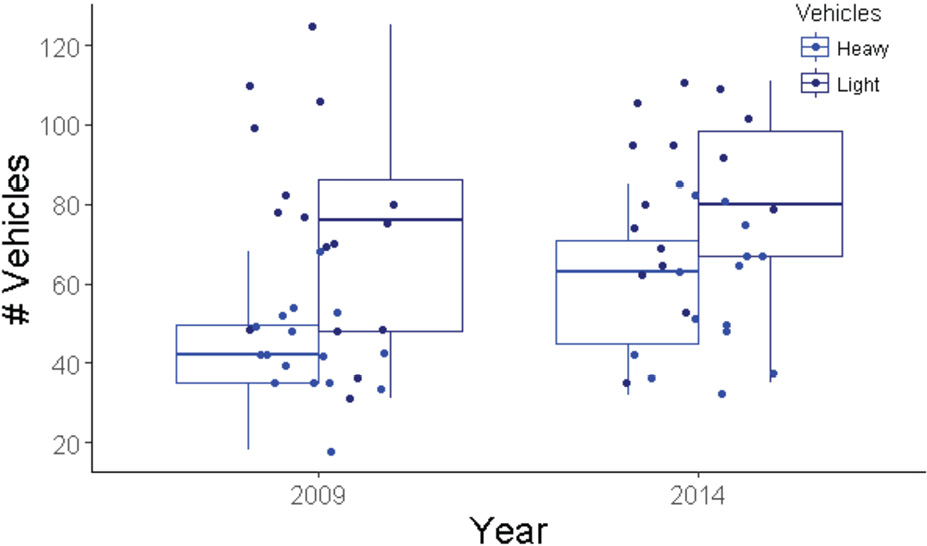
Figure 4. Traffic volumes by vehicle types recorded in Santa Rosa National Park between 2009 and 2014. Horizontal, box and vertical line show the median, 2nd and 3rd quartile respectively. Scatter shows the actual values.
Carara had significantly higher maximum noise levels than Santa Rosa and Poás (F = 299.2, DF = 930, P < 2.2e-16). Noise was highly variable for Poás and Santa Rosa compared to Carara (Figure 5). On average, noise in Carara was 26.07 dB louder than Poás (P < 2.2e-16) and 6.42 dB with respect to Santa Rosa (P = 0.00025). Noise levels did not differ on weekdays compared to weekends (P = 0.93), but was on average 3.44 dB higher in the afternoons than in the mornings for Carara (P = 0.015). In Santa Rosa, noise was 6.2 dB higher in the afternoons than in the mornings (P = 1.2e-06) and 4.4 dB lower during weekend than weekdays (P = 0.00049). Small sample sizes for Poás did not allow running a model with type of days and time of day.
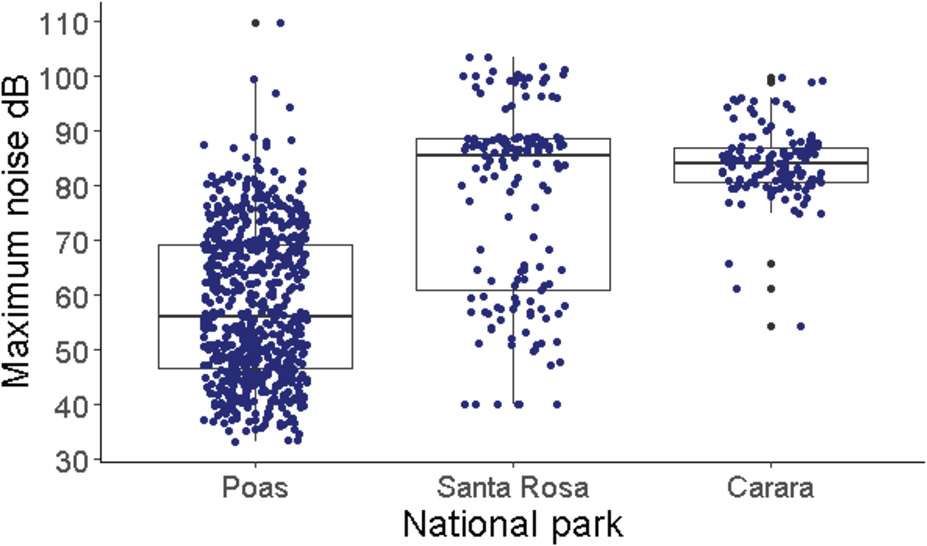
Figure 5. Maximum noise levels recorded in the three focal protected areas between 2009 and 2017. Horizontal, box and vertical line show the median, 2nd and 3rd quartile respectively. Scatter shows the actual values.
3.3. Seasonal assessment of noise transmission through the forest
3.3.1. Carara
Average maximum noise decreased significantly with distance from the road both in the wet and dry season (Table 3). This decrease in noise level as it penetrates the forest is best explained by the logarithmic model (Table 3). Noise was attenuated by the forest from levels of about 94 dB to average levels close to 60 dB within the first 100 m from the noise source at the road, decreasing gradually to levels close to 50 dB at 650 m from the road (Figure 6). Noise decreased on average 6.0 dB with increasing distance towards the inner forest and was significantly higher in the dry season than in the wet season by 2.53 dB (P = 0.0001). This difference is mainly within the first 100 m of distance from the road, and after 200 m the lines overlap a great deal (Figure 6).
Table 3. Summary of the AICc results for the models regarding noise transmission from the road through the inner forest in Carara National Park. LM = linear model, GAM = additive model and LOG = logarithmic model. All models are significant, with the LOG being the best, according to the AICc.
|
Model |
df |
AICc |
ΔAICc |
Weigh |
|
LM |
4 |
5989.1 |
98.9 |
< 0.001 |
|
GAM |
11.5 |
5892.6 |
2.4 |
0.23 |
|
LOG |
4 |
5890.3 |
0 |
77 |
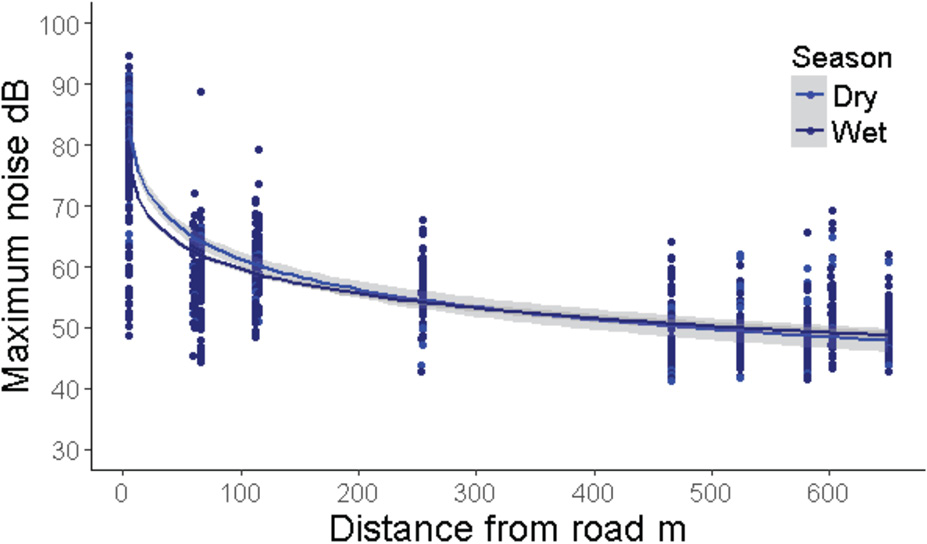
Figure 6. Seasonal noise transmission through the forest using maximum levels in Carara National Park, 2012. Line represents the logarithmic model (r2 = 0.76).
3.3.2. Santa Rosa
Similar to Carara, average maximum noise decreased significantly with distance from the road in both seasons and was best explained by the logarithmic model (Table 4). However, the differences in noise levels between seasons were greater than those in Carara. Noise was on average 4.5 dB higher in the dry season than in the wet season (P = 0.0003). Average noise level decreased 6.8 dB with the increasing distance towards the inner forest (Figure 7).
Table 4. Summary of the AICc results for the models regarding noise transmission from the road through the inner forest in Santa Rosa National Park. LM = linear model, GAM = additive model and LOG = logarithmic model. All models are significant, with the LOG being the best according to the AICc.
|
Model |
df |
AICc |
ΔAICc |
Weigh |
|
LM |
4 |
837.3 |
62.9 |
< 0.001 |
|
GAM |
10.8 |
787.1 |
12.7 |
0.0018 |
|
LOG |
4 |
774.4 |
0 |
0.998 |
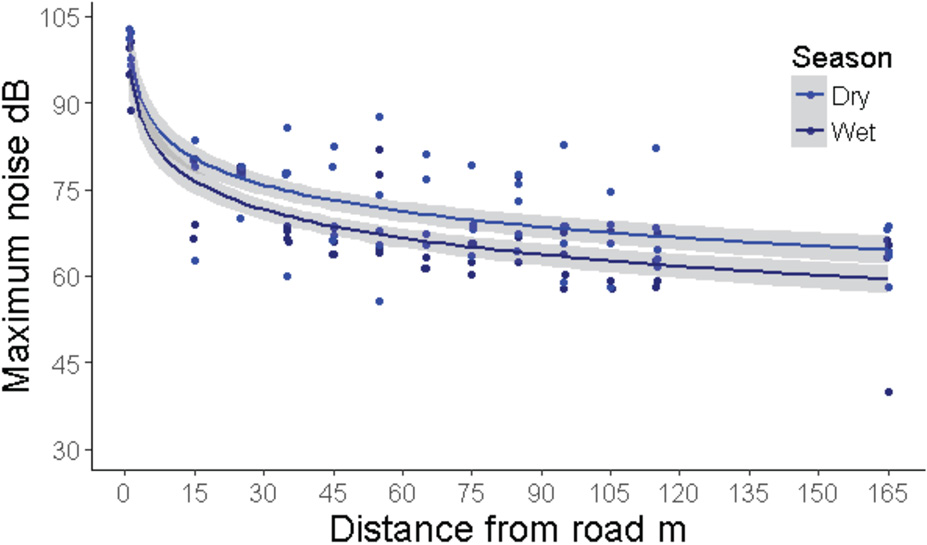
Figure 7. Seasonal noise transmission through the forest using maximum levels in Santa Rosa National Park, 2009. Line represents the logarithmic model (r2 = 0.66).
3.4. Biophony and environmental noise
3.4.1. Biophony
Total amount of biophony was significantly lower in sites close to the road than in sites far from the road (Figure 8). However, the amount of biophony tended to be more variable in far than in close sites. On average, there were 24.7 seconds more in biophony in far sites compared to those found in close sites (F = 29.51, DF = 184, P = 1.747e-07).
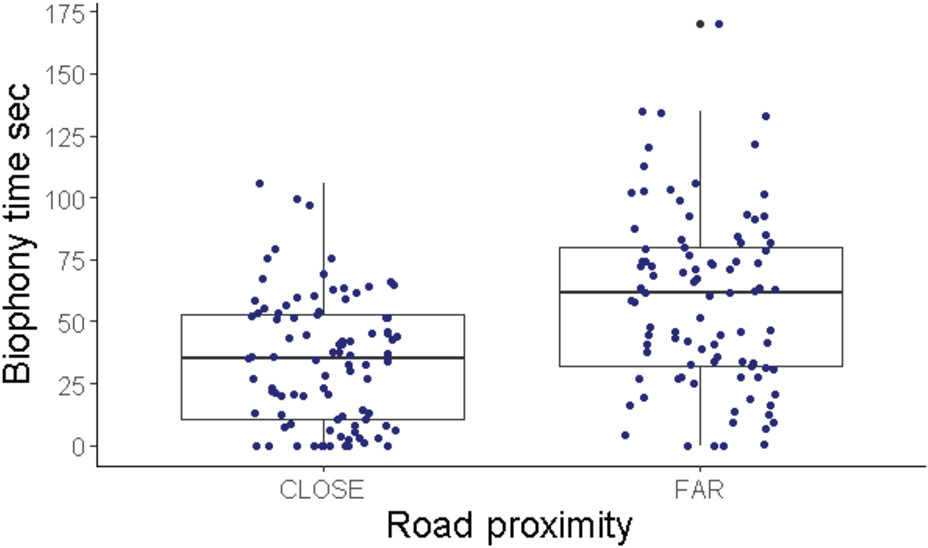
Figure 8. Biophony time recorded in Carara National Park, 2012. Horizontal, box and vertical line show the median, 2nd and 3rd quartile respectively. Scatter shows the actual values.
3.4.2. Environmental sound maps
Sound interpolation shows that the loudest sampling points were close to the road, evidencing that the source of high levels of the sound correspond to maximum levels of traffic noise (Figure 9A). Although minimum sound levels were considerably lower than maximum sound levels close to the road, the loudest minimum sound was recorded at the point in the stream (Figure 9B). These sound maps illustrate how maximum noise from the trafficked road masks the natural sound generated by the stream (geophony) within the protected area.
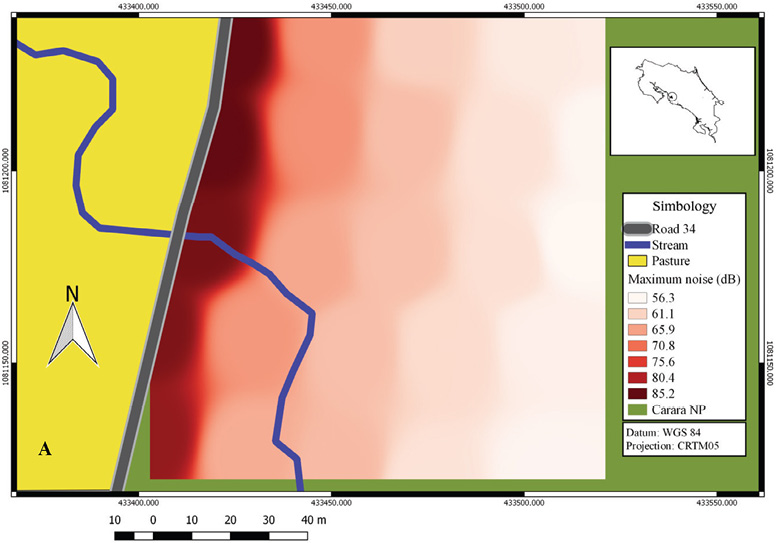
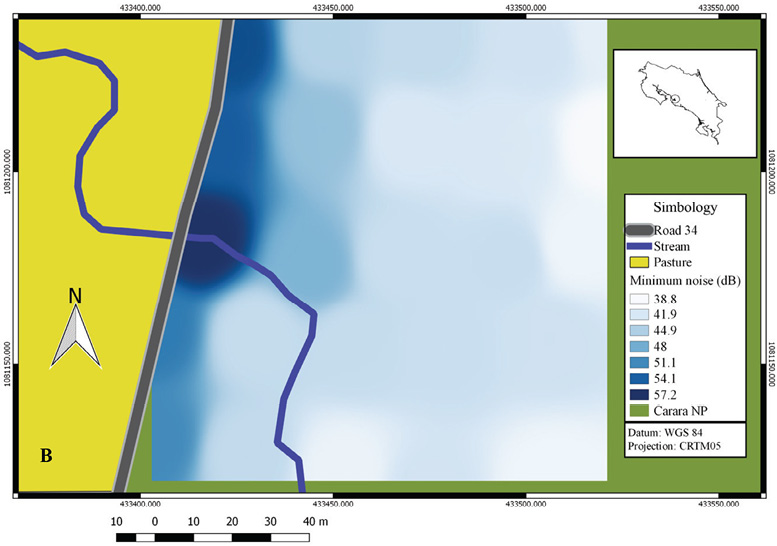
Figure 9. Environmental sound maps of all sounds (Biophony, geophony and anthrophony). A) Interpolation of the average maximum sound and B) Interpolation of the average minimum sound in Carara National Park, 2015
4. Discussion
Twenty six percent of Costa Rica is under several categories of protection (SINAC, 2011). We found that 70 protected areas were located in close proximity to road networks. Our results show that 41 % of all protected areas in Costa Rica are directly or indirectly influenced by the road-effect zone (Forman et al., 2003). We believe that the distance of two kilometers used in this analysis is expected to generate negative effects on the protected areas for the following reasons: road networks are impervious surfaces that generate changes in the hydrology system, altering stream composition, and increasing sediment concentrations through erosion and air pollution (Forman et al., 2003; Coffin, 2007; Leonard and Hochuli, 2017). A particular important aspect is that the majority of the areas in this study are in the category of protected zones, typically located in hilly terrain to enhance watershed protection. Another reason accounting for disturbances is noise pollution. Noise levels could be high in some highways, especially when heavy trucks make an important portion of the traffic volume (Eigenbrod, Hecnar and Fahrig, 2009). For instance, road density and noise affected frog species richness at the scale of ≤ 5 km in different landscapes in the United States (Marsh, et al., 2016). Other factors that may also affect protected areas within two kilometers of distance are illumination from vehicles at night and chemical pollutants carried by wind and runoff (Forman et al., 2003; Coffin, 2007; Leonard and Hochuli, 2017).
We found that 33.6 % of the 70 protected areas located within two kilometers are traversed or have adjacent roads. Clearly, this proximity condition is expected to exacerbate the negative effects roads exert on wildlife. For instance, an estimated number of 4709 vertebrates were killed by vehicles, particularly amphibians, in Carara National Park during a year period study (Arévalo et al. 2017).
Our focus on road usage and noise pollution evidenced that volumes and composition of traffic may affect differentially some protected areas. Carara had the highest traffic volume, and consequently, the highest noise level than Santa Rosa and Poás. However, Santa Rosa was almost as noisy as Carara and significantly noisier than Poás even when traffic volumes between Santa Rosa and Poás did not differ significantly. A plausible explanation for this might be traffic composition regarding type of vehicles. Heavy trucks accounted for 44 % of the traffic in Santa Rosa whereas in Carara, heavy trucks accounted for 14 % and only 4 % in Poás. In this study, heavy trucks, particularly trailers, are usually loud and generated levels of noise over 100 dB and up to 109 dB on the road. It is worthwhile to mention that levels of 110 dB cause ear damage in cattle (Phillips, 2009), so it may well cause discomfort to wild species with similar hearing capabilities.
The noise generated at the road was attenuated by the forest, decreasing with the distance in a logarithmic manner. However, the strength of the attenuation differed significantly between seasons in Carara and Santa Rosa. The seasonal effect was due to the decrease in foliage density, especially in the dry forest of Santa Rosa, where the majority of the trees had no foliage in the dry season. This condition allowed higher levels of noise during noise transmission in the dry season compared to the wet season. Carara has a shorter dry season than Santa Rosa, so the effect of seasonality is less notable. In both national parks, noise penetrated the forest with levels between 55 and 65 dB at 150 m from the road; levels that are considered disturbing to vertebrates. For example, noise reduced the density of breeding birds in deciduous and coniferous forest within a range of 40 to 1,500 m from the road with an average traffic volume of 10 000 vehicles a day in the Netherlands (Reijnen et al., 1995). Based on the average vehicles per hour, the Route 34 intersecting Carara would have a similar daily traffic volume than that of the study conducted in the Netherlands. However, forest structure and latitude limit a straight forward comparison between these two studies.
The amount of biophony was significantly lower close than far from the road in Carara. It is likely that this difference is related to a decrease in bird density close to the road where noise is highest, as it was found by a previous study in Carara in which bird density and bird species richness decreased with noise (Arévalo and Newhard, 2011). Noise may interfere with bird communication (Grade and Kathryn, 2016; Kleist et al., 2016), induce stress (Kight and Swaddle, 2011) and can alter mating and breeding processes (Reijnen et al., 1995; Schmidt, Morrison and Kunc, 2014). Thus, some species of forest birds may be forced to move away towards the inner forest to avoid the negative effects of road noise.
4.1. Implications on conservation and management
Although categories of protection may have specific goals, the main focus of any protected area is to conserve biodiversity. To achieve this, we must consider all aspects that characterize ecological processes at the landscape level. Protected areas in Costa Rica are situated in different landscape compositions with different effects by the surrounding matrix. Furthermore, this study shows that road usage, type of vehicles and the day of the week determine the level of noise produced near protected areas. For instance, access roads within parks, such as the one in Poás, remain without vehicles outside the normal visiting hours. In contrast, parks like Santa Rosa and Carara are subjected to traffic 24 hours. In addition, the Route 34, also known as the Coastal Road, connects with many tourist destinations thus increasing traffic volumes in weekends compared to weekdays. The opposite was found in Santa Rosa where the roads are used less by tourists. In addition, higher levels of noise penetrate the forest in the dry season in comparison to the wet season. The information presented here could be used for the designing of management plans to minimize the negative effects of noise. Although we did not directly test the effect of noise on the biophony, we believe that the reduction in the amount of biophony may be partly attributed to traffic noise. This is based on the interference of noise on bird communication. In addition, natural sounds like the stream (geophony) in our study are masked by loud traffic noise as evaluated by the sound maps. We believe that traffic noise may contribute to the degradation of the biophony and geophony which are key components of the soundscapes that are under protection.
Concern about the increasing expansion of roads in tropical areas (Laurence et al., 2015) and the increasing levels of anthropogenic noise are encouraging biologists, conservationists and managers as well as policy makers, to seek informed solutions to these environmental stressors (Francis and Barber, 2013). The construction of new road infrastructure requires rigorous planning, and must involve all possible stakeholders that would be affected and who would be benefited. Research before the construction of news roads is needed to balance the potential negative effects, particularly in close proximity to national parks (e. g. Caro, 2015). Thus, several options must be balanced to minimize negative effects on the environment and maximize economic growth (Hopcraft et al., 2015). In Costa Rica, tourism has been steadily increasing over the last 20 years along with road infrastructure. A wildlife friendly road network manual has been recently published with the aim to guide the different stakeholders in the construction and road usage to minimize negative effects (Pomareda et al., 2015).
5. Conclusions
Noise is a pervasive stressor generated by human made extensions. Road networks are spatially disposed in different landscapes and are being expanded to allow commerce and human transportation. If not well planned, the increase in roads and their associated noise will further encroach more protected areas in Costa Rica. We believe that a decrease or loss of natural sounds to traffic noise degrade habitats within protected areas, which is detrimental for the conservation of biodiversity across landscapes.
6. Acknowledgements
We are grateful to all the students of the School for Field Studies (Costa Rica) that participated in the collection of traffic and noise data. We highly appreciate the collaboration of all park administrators for facilitating infrastructure and orientation. The authors gratefully acknowledge the key financial and logistical support provided by the School for Field Studies.
7. References
Achilleos, G. A. (2011). The Inverse Distance Weighted interpolation method and error propagation mechanism – creating a DEM from an analogue topographical map. Journal of Spatial Science, 56(2), 283-304. Doi: 10.1080/14498596.2011.623348
Arévalo, J. E. and Knewhard, K. (2011). Traffic noise affects bird species in a protected tropical forest. Revista de Biología Tropical, 59(2), 969-980.
Arévalo J. E. and Ladle, R. J. (2016). Challenges to Forest Conservation. In: S. A. Molina-Murillo and C. Rojas (Eds.), The Paradigm of Forests and the Survival of the Fittest (pp. 172-195). USA: CRC Press. Doi: doi.org/10.1201/b19975-8
Arévalo, J. E., Honda, W., Arce-Arias, A. and Häger, A. (2017). Spatiotemporal variation of roadkills show mass mortality events for amphibians in a highly trafficked road adjacent to a national park, Costa Rica. Revista de Biología Tropical, 65(4), 1261-1276. doi: 10.15517/rbt.v65i4.27903
Caro, T. (2015). Roads through national parks: a successful case study. Tropical Conservation Science, 8(4): 1009-1016. Doi: 10.1177/194008291500800411
Chape, S., Harrison, J., Spalding, M. and Lysenko, I. (2005). Measuring the extent and effectiveness of protected areas as an indicator for meeting global biodiversity targets. Philosophical Transactions of the Royal Society B, 360(1454), 443-455. Doi: 10.1098/rstb.2004.1592
Coffin, A. W. (2007). From roadkill to road ecology: A review of the ecological effects of roads. Journal of Transport Geography, 15, 396-406. Doi: 10.1016/j.jtrangeo.2006.11.006
Dulac, J. (2013). Global land transport infrastructure requirements. Paris: International Energy Agency.
Eigenbrod, F., Hecnar, S. J. and Fahrig, L. (2009). Quantifying the Road-Effect Zone: Threshold Effects of a Motorway on Anuran Populations in Ontario, Canada. Ecology and Society, 14(1): 24. Doi: 10.5751/ES-02691-140124
Fahrig, L. (2003). Effects of habitat fragmentation on biodiversity. Annual Review of Ecology, Evolution, and Systematics, 34, 487-515. Doi: 10.1146/annurev.ecolsys.34.011802.132419
Farina, A. (2014). Soundscape Ecology: Principles, Patterns, Methods and Applications. Italy: Springer. Doi: 10.1007/978-94-007-7374-5
Francis, C. D., Ortega, C. P. and Cruz, A. (2010). Vocal frequency change reflects different responses to anthropogenic noise in two suboscine tyrant flycatchers. Proc. R. Soc. B., 282, 1-7. Doi: 10.1098/rspb.2010.1847
Forman, R. T. T., Sperling, D., Bissonette, J., Clevenger, A., Cutshall, C. D., Dale, V. H. and Winter, T. C. (2003). Road Ecology: Science and solutions. Washington D.C.: Island Press.
Francis, D. and Barber, J. R. (2013). A framework for understanding noise impacts on wildlife: an urgent conservation priority. Frontiers in Ecolology and the Environment,11(6), 305-313. Doi: 10.1890/120183
Grade, A. M. and Sieving, K. E. (2016). When the birds go unheard: highway noise disrupts information transfer between bird species. Biology Letters, 12(4). Doi: 10.1098/rsbl.2016.0113
Holdridge, L. R. (1966). The life zone system. Adansonia, 6(2),199-203.
Hopcraft, J. G. C., Bigurube, G., Lembeli, J. D. and Borner, M. (2015). Balancing Conservation with National Development: A Socio-Economic Case Study of the Alternatives to the Serengeti Road. PLOS ONE, 10(7), e0130577. Doi: 10.1371/journal.pone.0130577
Kight, C. R. and Swaddle, J. P. (2015). Eastern Bluebirds Alter their Changes in the Acoustic Environment. Integrative and Comparative Biology, 55(3), 418-431. Doi: 10.1093/icb/icv070
Kleist, N. J., Guralnick, R. P., Cruz, A. and Francis, C .D. (2016). Anthropogenic noise weakens territorial response to intruder’s songs. Ecosphere, 7(3), e01259. Doi: 10.1002/ecs2.1259
Laurence, W. F., Goosem, M. and Laurance, S. G. W. (2009). Impacts of roads and linear clearings on tropical forests. Trends in Ecology and Evolution, 24(12), 659-669. doi: 10.1016/j.tree.2009.06.009
Laurance, W. F., Peletier-Jellema, A., Geenen, B., Koster, H., Verweij, P., Van Dijck, P. and Van Kuijk, M. (2015). Reducing the global environmental impacts of rapid infrastructure expansion. Current Biology Magazine, 25, R255–R268. Doi: 10.1016/j.cub.2015.02.050
Leonard, R. J. and Hochuli, D. F. (2017). Exhausting all avenues: why impacts of air pollution should be part of road ecology. Frontiers in Ecology and the Environment, 15(8), 1-7. Doi: 10.1002/fee.1521
Marsh, D. M., Cosentino, B. J., Jones, K. S., Apodaca, J. J., Beard, K. H., Bell, J. M. and Vonesh, J. R. (2016). Effects of roads and land use on frog distributions across spatial scales and regions in the Eastern and Central United States. Diversity and Distributions, 23(2), 1-13. Doi: 10.1111/ddi.12516
McClure, C. J. W., Ware, H. E., Carlisle, J., Kaltenecker, G. and Barber, J. R. (2013). An experimental investigation into the effects of traffic noise on distributions of birds: avoiding the phantom road. Proceedings of the Royal Society B, 280(1773), 1-9. Doi: 10.1098/rspb.2013.2290
Monge-Nágera, J. (1996). Vertebrate mortality on tropical Highways: The Costa Rican case. Vida Silvestre Neotropical, 5(2), 154-156.
Payne S. R., Davies, W. J. and Adams, M. D. (2009). Research into the Practical and Policy Applications of Soundscapes Concepts and Techniques in Urban Areas (NANR 200). London: DEFRA.
Pomareda, E. (Octuber 17th 2012). Una amenaza real de atropellos de animales silvestres. Seminario Universidad. Recuperado de https://semanariouniversidad.com/opinion/una-amenaza-real-atropello-de-animales-silvestres/
Potvin D. A., Parris, K. M. and Mulder, R. A. (2011). Geographically pervasive effects of urban noise on frequency and syllable rate of songs and calls in silvereyes (Zosterops lateralis). Proceeding of the Royal Society B, 278(1717), 2464-2469. Doi: 10.1098/rspb.2010.2296
Phillips, C. J. C. (2009). Housing, handling and the environment for cattle. Principles of cattle production (chapter 5). Modular Texts, Queensland, Australia. Doi: 10.1079/9781845933975.0095
Proppe, D. S., Sturdy, C. B. and St. Clair, C. C. (2013). Anthropogenic noise decreases urban songbird diversity and may contribute to homogenization. Global Change Biology, 19(4), 1075-1084. Doi: 10.1111/gcb.12098
Reijnen, R., Foppen, R., Ter Braak, C. and Thissen, J. (1995). The Effects of Car Traffic on Breeding Bird Populations in Woodland. III. Reduction of Density in Relation to the Proximity of Main Roads. Journal of Applied Ecology, 32(1), 187-202. Doi: 10.2307/2404428
Rojas-Chacón, E. (2011). Atropello de vertebrados en una carretera secundaria en Costa Rica. Cuadernos de Investigación UNED, 3(1), 81-84. Doi: 10.22458/urj.v3i1.209
Rodewald, A. D. (2003). The importance of land uses within the landscape matrix. Wildlife Society Bulletin, 31(2), 586-592. Recovered from http://www.jstor.org/stable/3784344
Slabbekoorn H. (2013). Songs of the city: Noise-dependent spectral plasticity in the acoustic phenotype of urban birds. Animal Behaviour, 85(5), 1089-1099. Doi: 10.1016/j.anbehav.2013.01.021
Schmidt, R., Morrison, A. and Kunc, H. P. (2014). Sexy voices e no choices: male song in noise fails to attract females. Animal Behaviour, 94, 55-59. Doi: 10.1016/j.anbehav.2014.05.018
Shannon, G., McKenna, M. F., Angeloni, L. M., Crooks, K. R., Fristrup, K. M., Brown, E. and Wittemyer, G. (2016). A synthesis of two decades of research documenting the effects of noise on wildlife. Biological Reviews, 91(4), 982-1005. Doi: 10.1111/brv.12207
SINAC (Sistema Nacional de Áreas de Conservación). (2011). Políticas para las Áreas Silvestres Protegidas (ASP) del Sistema Nacional de Áreas de Conservación (SINAC). Recovered from http://www.sinac.go.cr/ES/docu/ASP/Pol%C3%ADticasASPSINAC2011.pdf
Soutullo, A. (2010). Extent of the Global Network of Terrestrial Protected Areas. Conservation Biology, 24(2), 362-362. Doi: 10.1111/j.1523-1739.2010.01465.x
TEC (Instituto Tecnológico de Costa Rica). (2014). Atlas de Costa Rica. Recovered from https://repositoriotec.tec.ac.cr/handle/2238/6749?show=full
Van der Ree, R., Smith, D. J. and Grilo, C. (2015). The ecological effects of linear infrastructure and traffic: challenges and opportunities of rapid global growth. In: R. Van der Reed, D. J. Smith and C. Grilo (Eds). The handbook of road ecology (pp. 1-9). U. K.: Wiley Blackwell. Doi: 10.1002/9781118568170.ch1
 |
 |
 |
 |
Los artículos publicados se distribuye bajo una Licencia Creative Commons Atribución 4.0 Internacional (CC BY 4.0) basada en una obra en http://www.revistas.una.ac.cr/ambientales., lo que implica la posibilidad de que los lectores puedan de forma gratuita descargar, almacenar, copiar y distribuir la versión final aprobada y publicada del artículo, siempre y cuando se mencione la fuente y autoría de la obra. |
|