 |
e-ISSN: 2215-2563 Número 61E (3) Especial CLAG • Julio-diciembre 2018 Doi: http://dx.doi.org/10.15359/rgac.61-3.15 Páginas de la 297 a la 231 del documento impreso Recibido: 30/6/2018 • Aceptado: 16/7/2018 |
¿Que nos depara el futuro? Análisis climático histórico y proyección de escenarios climáticos futuros para el cantón andino de Pedro Moncayo, Ecuador
What does the future hold? Historical climate analysis and projection of future climatic scenarios for the andean canton of Pedro Moncayo, Ecuador
Natali Cáceres-Arteaga1
Universidad Central del Ecuador, Ecuador
Oscar Ayala-Campaña2
Darwin Rosero-Vaca3
Instituto Nacional de Meteorología e Hidrología, Ecuador
K. Maria D. Lane4
University of New Mexico, USA
|
Resumen Las variaciones naturales y antropogénicas de los sistemas climáticos son cada vez más evidentes. El cambio climático se ha convertido en el tema central de la investigación para la toma de decisiones a todo nivel. El objetivo principal de esta investigación es identificar la evidencia de cambios en ciertos elementos climáticos, como la precipitación y la temperatura a escala local en Pedro Moncayo, Ecuador. Se utilizó información brindada por las 126 estaciones meteorológicas del Instituto Nacional de Meteorología e Hidrología más cercanas al área de estudio y sus registros desde 1981 hasta 2017. Sistemas de Información Geográfica (SIG) se utilizaron para el análisis estadístico y la representación geográfica. Este es el primer estudio que presenta escenarios climáticos a escala local en el Ecuador, y pretende ser un aporte para la comunidad científica, pero sobre todo para las comunidades vulnerables en sus procesos de planificación y fortalecimiento de su capacidad de adaptación. Palabras clave: cambio climático, variabilidad histórica, escalas, Ecuador Abstract The natural and anthropogenic variations of climate systems are increasingly evident. Climate change has become the central theme of research for decision making at all levels. The principal objective of the current research is to identify the evidence of change in certain climatic elements, such as precipitation and temperature at the local scale in Pedro Moncayo, Ecuador. The study uses records from 1981-2017 produced by 126 meteorological stations of the National Institute of Meteorology and Hydrology closest to the study area. Geographical Information Systems were used for statistical analysis and geographical representation. This is the first study that presents climate scenarios at local scale in Ecuador, It aims to be a contribution for the scientific community, but especially for vulnerable communities in their planning processes and strengthening their adaptation capacity. Keywords: climate change, historical variability, scales, Ecuador. |
Introduction
The natural and anthropogenic variations of climate systems are increasingly evident. Climate change has become the central theme of research for decision making at the global, regional, national, and local levels.
The best summary of the research and publications generated by the scientific community is published as Reports of the Intergovernmental Panel on Climate Change - IPCC. These reports, among other evidence, indicate an increased frequency in extreme climate events, highlighting the probability that this situation will continue in the future. This signals that the main problem is not necessarily variation in average monthly values, but in annual values.
Thinking about vulnerability, adaptation and adaptation capacity, special attention will also need to be given to scales. There is uncertainty as to how local populations and eco-systems will be affected by and adapt to these changing conditions at various spatial scales, particularly in the vulnerable regions of the Global South (Roy, 2018).
Ecuadorian regulations indicate that national, regional, and local development and planning instruments must consider climate change and risk management on their provincial, cantonal, and municipal Plans of Development and Territorial Ordinance - PDOTs. In May 2014, Ecuador’s Ministry of Environment established general guidelines for its Decentralized Autonomous Governments to incorporate climate change in local planning through plans, programs, and climate change strategies, for their subsequent officialization as Climate Change Plans (Ministerio del Ambiente, 2014).
Despite this, the consideration of actual and future climate on the PDOTs is scarce and insufficient to sustain decision-making processes. National documents, such as the three National Communications on Climate Change presented by Ecuador before the United Nations Framework Convention on Climate Change -UNFCCC in 2000, 2011, and 2017, summarize evidence of changes in Ecuador’s climate systems at the national scale and highlight the increasing frequency of extreme climate events. However, the studies were carried out at the national scale, compromising their use for analyzing climate change effects, impacts, and adaptation capacity at local levels.
The Decentralized Autonomous Government of Pedro Moncayo Canton updated its PDOT in March 2015 with a 2025 horizon, including limited references to historical precipitation and temperature averages during 1985-2009. Relying on historical data from only 6 meteorological stations, the PDOT does not include future climate change scenarios and does not consider the mandatory guidelines issued by the Ministry of the Environment to include climate change in long-term planning.
To remedy this problem, this paper offers a scale-sensitive approach to climate data in Pedro Moncayo. It presents the scientific evidence and support needed by the local government to plan for climate change effects, obtain resources necessary for effective preparation, and increase the canton’s adaptation capacity.
Area of study and General Characteristics
Pedro Moncayo is located in the Inter-Andean region, northeast of the province of Pichincha, with altitudes that vary between 1730 and about 4300 meters above sea level. It forms part of the Esmeraldas river basin, which includes the Guayllabamba, San Pedro, Pita, Pisque and Blanco rivers that flow into the Pacific (see Figure 1). It occupies an area of 339 km2 with a population of 37.802 in 2014.5
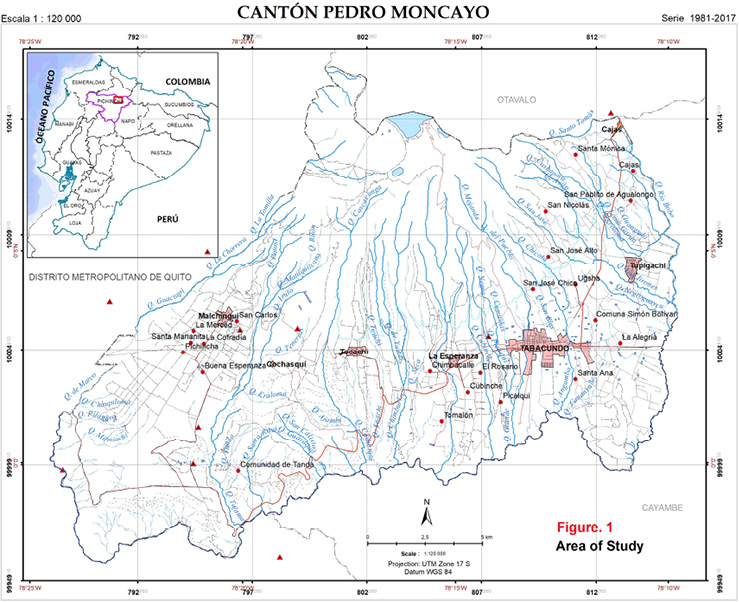
Source: SENPLADES-IEE-MAGAP (Ecuador) [Basic Cartography]. Pedro Moncayo. Scale 1:25,000. Quito, 2013.
The majority of the Pedro Moncayo territory is devoted to agriculture (58.1%) and shrub and herbaceous vegetation (30.6%). (Gobierno Autónomo Descentralizado de Pedro Moncayo, 2015). It is characterized by social, economic, and environmental diversity, with a recent boom in the floriculture industry at the expense of agriculture.
Climate Change: Impacts, Uncertainty and Adaptation
Scholarly understanding of the causes and impacts of climate change has focused on the characteristics of globality, longevity, irreversibility and uncertainty. It is global, indifferent to where the Green House Gas emissions - GHG occur and spread through the atmosphere, heterogeneously generating impacts in the world. It is long-term because increases of temperature and sea level are expected for the next decades and centuries (Wagner, 2015). This contributes to the problem of irreversibility. The greenhouse effect of natural origin, which allows life on the planet, has intensified with the contribution of emissions generated by human activity. This intensified level, as well as its current and future impacts, may not be reversible. Past and current emissions remain in the atmosphere for a long time and generate impacts beyond the measures that can be taken to reduce them.
Among the major uncertainties, the temporal evolution of GHG emissions is key. Changes in the climate system depend on changing GHG emissions, which in turn depend on the socio-economic development and climate policies to be adopted. To acknowledge this, the IPCC presents four scenarios6, showing temperature increases ranging between 1.5°C and 4.5°C by the end of this century (IPCC, 2014). Beyond this, there are important uncertainties in the spatial and temporal scales of climate changes and impacts, especially for developing countries and those located in tropical and mountainous regions. Critically, climate models provide little certainty about how local populations will be affected by and adapt to climate conditions (Roy, 2018). There are two primary sources of uncertainty: first, imperfect knowledge of future trajectories of variables that can affect the climate system (mainly GHG emissions); second, imperfect knowledge of how changes in these variables will affect climate change (Burke et al., 2015).
The ultimate objective of the UNFCCC is:
to achieve the stabilization of greenhouse gas concentrations in the atmosphere at a level that would prevent dangerous anthropogenic interference with the climate system. Such a level should be achieved within a time frame sufficient to allow ecosystems to adapt naturally to climate change, to ensure that food production is not threatened and to enable economic development to proceed in a sustainable manner. (United Nations Framework Convention on Climate Change, 1992)
The relevant question then is: what is the dangerous level of emissions that can interfere with the climate system, and what is meant by adaptation?
The "dangerous level" can be relative, depending on the type of system or element of the system in question. However, an increase of more than 1.5°C to 2.0°C in the global average temperature has been highlighted as having dangerous implications if exceeded (IPCC, 2014; Meinshausen, 2009). The report identified risks of five integrative Reasons for Concern - RFCs that could be generated by exceeding certain values of the average global temperature: unique and threatened systems, extreme weather events, distribution of impacts, global aggregate impacts, and large-scale singular events
The Paris Agreement on Climate Change, signed in December 2015, sets an ambitious objective of limiting the global average temperature increase to well below 2°C or even 1.5°C above preindustrial levels. It recognizes that climate change impacts could be reduced significantly, while also “Increasing the ability to adapt to the adverse impacts of climate change and foster climate resilience and low greenhouse gas emissions development, in a manner that does not threaten food production.” (Conference of the Parties, 2015)
This focus on adaptation acknowledges that increased heating produces climate variations that can generate both negative and positive impacts, but that they typically produce and/or increase the vulnerability of weaker systems. Adaptation thus emerges as an alternative response to reduce the impacts of climate change and variability. The IPCC defines climate adaptation as: “Adjustment in natural or human systems in response to actual or expected climatic stimuli or their effects, which moderates harm or exploits beneficial opportunities” (IPCC, 2014). Others have refined this definition (Nuñez, 2016, Arnell, Tompkins & Adger, 2004, Berrang-Ford et al 2015, IPCC, 2012), noting that it refers to both process and outcome, and can be passive or reactive, spontaneous or planned (Smit, Burton, Klein, & Wandel, 2000).
To make plans for adaptation, planners require historical, current and future climate data with the least possible uncertainty, and they need these data at scales that support local-level assessments. To this end, this research presents the main characteristics of the current climate and future projections for the Canton Pedro Moncayo as an important contribution to its planning needs.
Methodology Framework
The World Meteorological Organization, following a longstanding norm in the scientific community, uses statistics as a basic methodological tool for consolidating meteorological data into temporal and spatial series. This study used statistical interpolation to improve both the spatial and temporal certainty for climate data in the study area.
Pedro Moncayo has only a few meteorological stations within the canton, yet there are many other nearby stations in neighboring cantons and throughout the region. For this study, 126 meteorological stations were identified from outside Pedro Moncayo in order to improve the mapping of spatial and temporal distribution of precipitation and temperature.
The meteorological stations were referenced on topographic maps of the Ecuadorian Military Geographical Institute at a scale of 1:50000. All monthly, quarterly, and annual series from 1981-2010 and 1981-2017, with variations in percentage terms (precipitation) and anomalies (temperature), were rendered in a Geographical Information System to generate maps of precipitation and temperature. The 1981-2017 series are used to identify the temporal and spatial distributions of precipitation and temperature. By comparing with the 1981-2010 series, which is considered standard by the World Meteorological Organization, we generate variation statistics showing increased or decreased precipitation and temperature (anomalies). For temperature maps, a Shuttle Radar Topography Digital Terrain Model (30-meter resolution) was used. Missing data were completed with CHIRPS series from the Climate Hazard Group or, in the case of temperature, with NASA series from the Prediction of Worldwide Energy Resource Climatology Resource for Agroclimatology and Global Modeling and Assimilation Office - GMAO.
To make future predictions, climate change scenarios were generated for Pedro Moncayo based on those prepared by Ecuador’s National Institute of Meteorology and Hydrology (and other institutions) and included in the Third National Communication on Climate Change. RCPs of 4.5 and 8.5 were considered.7 The comparison of current and future climate allowed us to project variations for the period 2031-2050.
Results
The climate in Ecuador as well as in Pedro Moncayo has changed in the last decades, which is perceived by the people and corroborated by the national statistics. An increase in frequency of extreme events is the common denominator, even when analyses are produced and presented at national level. At the canton level, the limited number of meteorological stations has given only very general climate signals. By adding spatially interpolated data from stations outside the canton and changing the temporal scale of the data, we gain a much more detailed view of the distribution and variations in both temperature and precipitation.
Precipitation
The climate of Pedro Moncayo, in general, is typical of the Ecuadorian highlands with a bimodal distribution: a maximum peak between the months of March and April and a secondary peak in October, along with a dry season between the months of June and September. The quarterly distribution of precipitation shows greater rainfall towards the flanks of the Andean Cordillera in the east and southeast. The south-central zone has the least precipitation during all four quarters of the year, with the lowest rainfall during the quarter of July to September (see Figure 2).
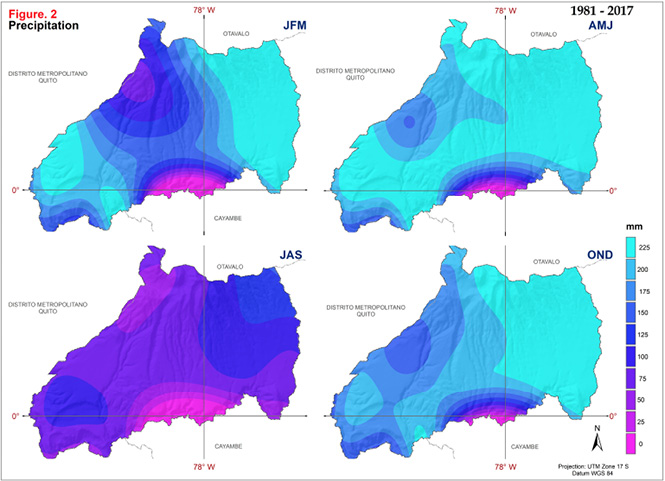
Source: INAMHI (Ecuador). Pedro Moncayo. Scale 1:50,000. Quito, 2018.
The geographical or spatial distribution of the precipitation variation (expressed in percentages) for the period 1981-2017 in relation to the normal (1981-2010), is heterogeneous with increases and decreases in certain areas in the four quarters, with a greater tendency to increase between January and March, especially in the southwest, which is reversed between July and September when the tendency to decrease is predominant. (see Figure 3). This means that in general terms, the precipitation in a larger part of the canton has increased between January to March, and has decreased between July and September.
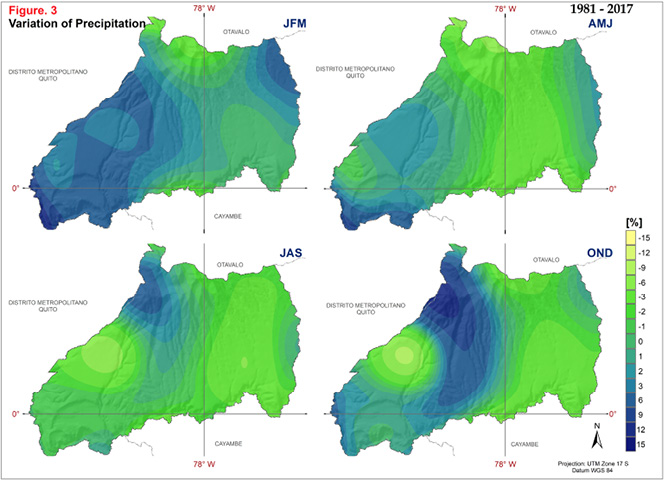
Source: INAMHI (Ecuador). Pedro Moncayo. Scale 1:50,000. Quito, 2018.
a)Temperature
The thermal regime of Pedro Moncayo responds to its orographic characteristics and location on the equatorial line. The average temperature has slight variations during the year, but there are important differences between day and night. The maximum midday temperature increases from the northeast to the southwest, where values are highest. On a quarterly basis, although the same geographical distribution is maintained, the highest values of the maximum temperature (up to 24-25°C) are recorded between July and September (see Figure 4). In terms of anomalies for the period 1981-2017, there is a generalized slight decrease in the maximum temperature, in greater magnitude in the northeast, especially between the quarter of July to September (see Figure 5).
The minimum nighttime temperature decreases from the west to the higher parts of the northeast, where the lowest values çare recorded (4-9°C) (see Figure 6). The anomalies of minimum temperature, although slight, are greater in the northeaster. The biggest negative anomalies occur in the months between July and September, which is climatologically considered as the dry season (see Figure 7).
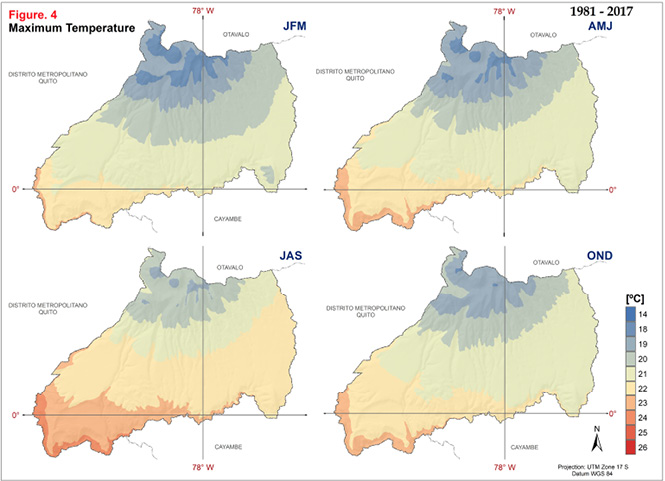
Source: INAMHI (Ecuador). Pedro Moncayo. Scale 1:50,000. Quito, 2018.
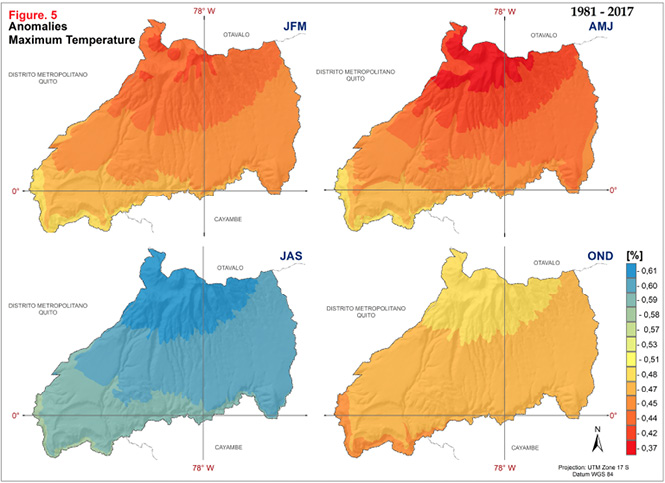
Source: INAMHI (Ecuador). Pedro Moncayo. Scale 1:50,000. Quito, 2018.
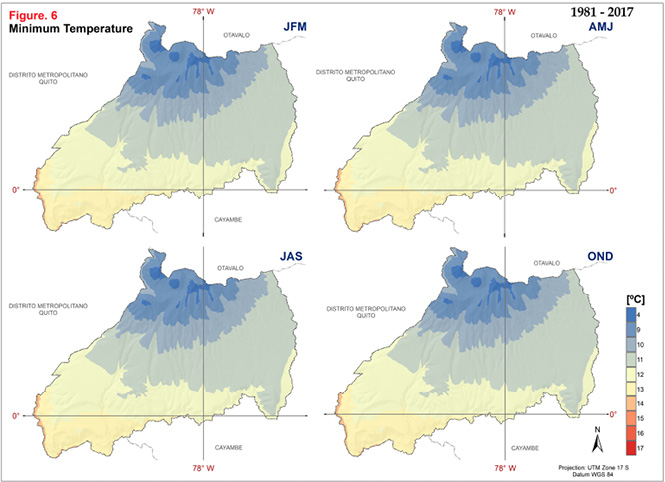
Source: INAMHI (Ecuador). Pedro Moncayo. Scale 1:50,000. Quito, 2018.
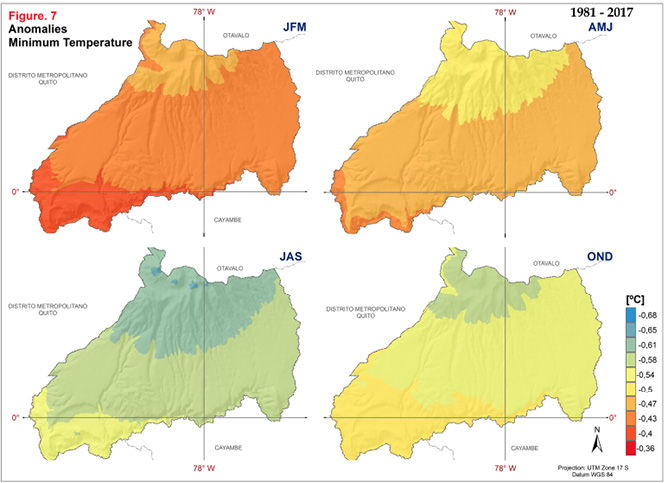
Source: INAMHI (Ecuador). Pedro Moncayo. Scale 1:50,000. Quito, 2018.
Current climate vs Future climate
The maps presented in this section show the spatial and temporal distribution of the variation between current and future climate. The current climate is represented by the average value of the period 1981-2017 and the future climate by the scenarios built for the period 2031-2050 under the 4.5 and 8.5 Representative Concentration Pathways (RCP) 8
By using the intermediate scenario (RCP 4.5) and the pessimistic scenario (RCP 8.5), we seek to cover the expected variation under extreme emission scenarios. RCP 2.5 is not used because, despite the fact that it is the objective of the Paris Agreement that will come into force as 2020, it seems very unlikely considering the actual circumstances (Aida Arteaga, 2017).
It should be noted that the current climate used in this research is different to that used for the Third National Communication on Climate Change presented by Ecuador before the UNFCCC. This difference is fundamentally based on three aspects: period considered, source of the database and methodology. This analysis is based on data from 126 meteorological stations located in and around the Canton Pedro Moncayo for the period 1981-2017.
•Temperature
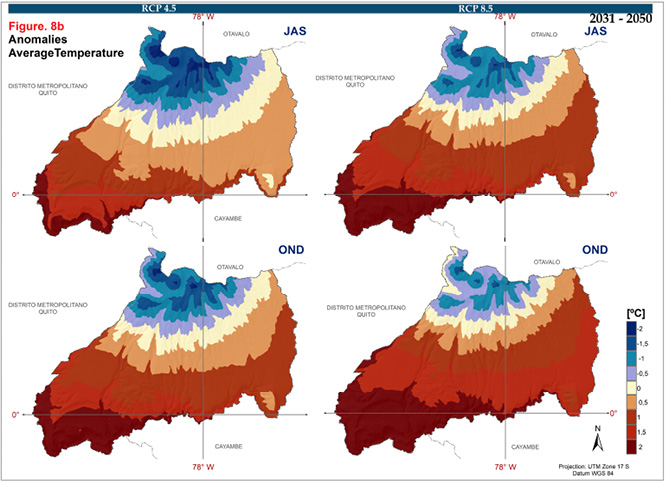
To identify quarterly trends, we calculated the anomaly of the average temperature between current climate (1981-2017) and future climate (2030-2050) expressed in degrees centigrade.
Under RCP 4.5, there is a decrease in the average temperature in the northern center and an increase in the rest of the canton in all the quarters. From quarter to quarter there are no major variations in the values of the anomalies (see left side of Figures 8a and 8b). Under RCP 8.5, the same geographical distribution of the anomalies is maintained, with a greater magnitude of the increase in temperature and less of the decrease in the north center of the canton (see right side of Figures 8a and 8b).
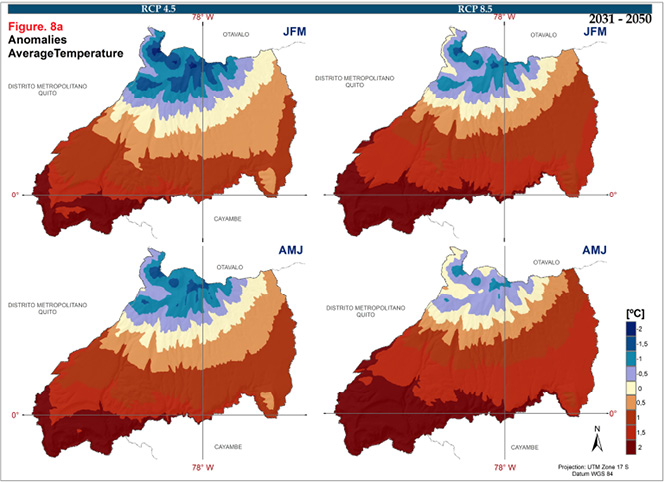
Source: INAMHI (Ecuador). Pedro Moncayo. Scale 1:50,000. Quito, 2018.
Source: INAMHI (Ecuador). Pedro Moncayo. Scale 1:50,000. Quito, 2018.
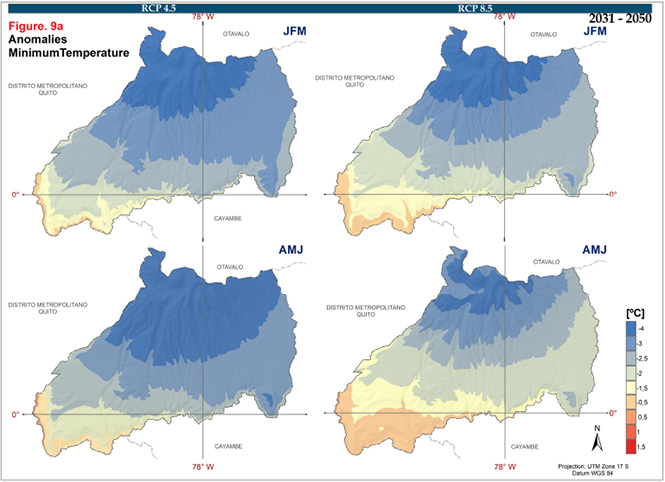
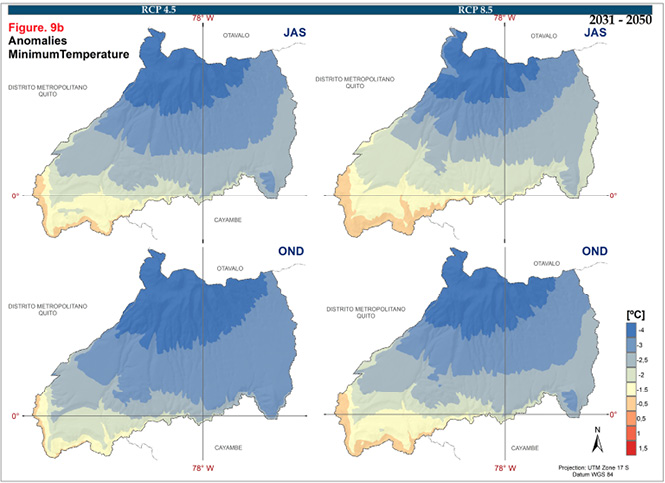
Under RCP 4.5 the minimum temperature decreases practically throughout the territory of the canton, with greater intensity in the northern center, especially in the quarter from July to September (see left side of Figures 9a and 9b). Under RCP 8.5 the minimum temperature decrease is maintained, but with a smaller magnitude, especially in the July-September quarter (see right side of Figures 9a and 9b).
Source: INAMHI (Ecuador). Pedro Moncayo. Scale 1:50,000. Quito, 2018.
Source: INAMHI (Ecuador). Pedro Moncayo. Scale 1:50,000. Quito, 2018.
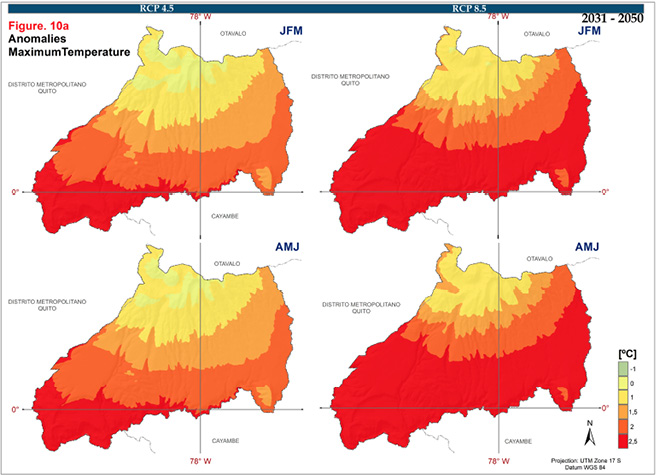
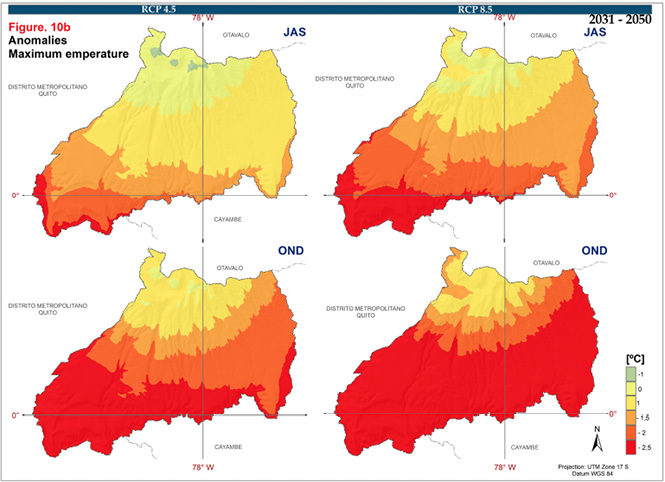
The maximum temperature under RCP 4.5 also increases practically throughout the entire territory, with a greater magnitude throughout the south, especially in the quarter from October to December. During the quarter from July to September, the increase is mainly concentrated in the southeast (see left side of Figures 10a and 10b). Under RCP 8.5, the generalized increase is of greater magnitude throughout the canton and throughout the year, with the exception of the central northern area. The increase is of smaller magnitude between the months of July and September (see right side of Figures 10a and 10b).
Source: INAMHI (Ecuador). Pedro Moncayo. Scale 1:50,000. Quito, 2018.
Source: INAMHI (Ecuador). Pedro Moncayo. Scale 1:50,000. Quito, 2018.
•Precipitation
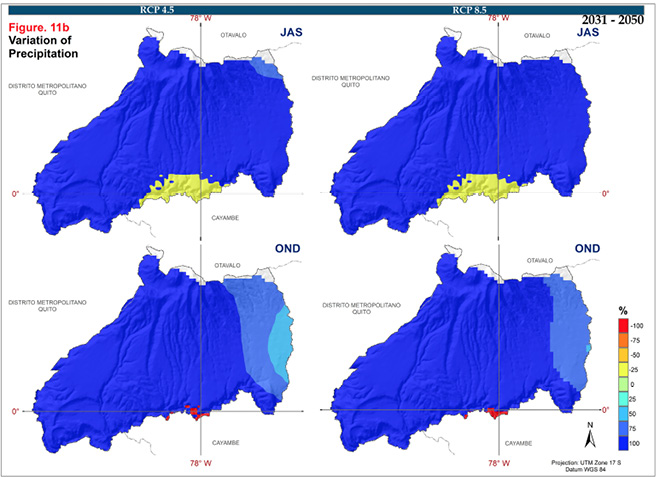
To identify quarterly trends, we calculated the variation of quarterly precipitation between current climate (1981-2017) and future climate (2031-2050) by percentage. The predicted percentage variation is predominantly positive, showing increased precipitation in almost the entire territory, with the exception of a small area south of the canton’s center.
During the four quarters and under RCP 4.5, the geographical distribution of the percentage variation is maintained, with a greater quantitative significance between January and March. (see left side of Figures 11a and 11b). Under RCP 8.5, both the spatial and temporal distribution (between the quarters) are maintained without major changes. (see right side of Figures 11a and 11b).
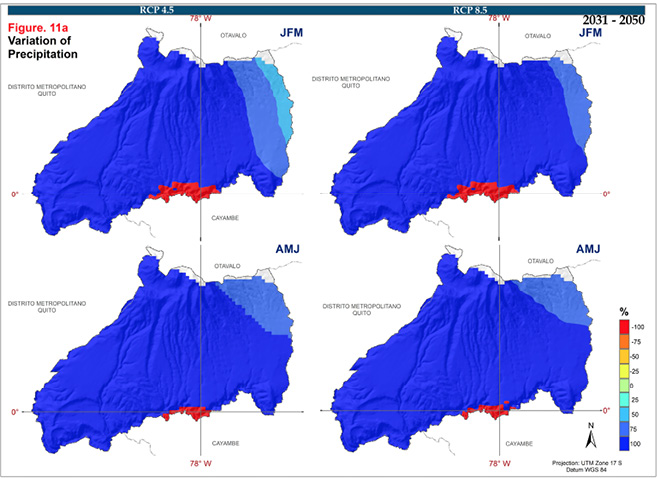
Source: INAMHI (Ecuador). Pedro Moncayo. Scale 1:50,000. Quito, 2018.
Source: INAMHI (Ecuador). Pedro Moncayo. Scale 1:50,000. Quito, 2018.
Discussion
This analysis indicates a homogeneous geographic distribution of precipitation, nighttime temperature, and daytime temperature, with slight variations between the quarters. Topography plays a fundamental role in this finding. Between 1981 and 2017, however, precipitation variation is temporally heterogeneous, with increases and decreases in several areas. The period between January to March (rainy season) shows an increase in precipitation, while decreases have occurred in the dry-season months of July to September.
Maximum temperature has increased slightly, especially in the northeast. This increase is greater in the months of July to September of the dry period. Minimum temperature has diminished slightly, especially in the dry season.
In the future, this study predicts an increased average temperature (with the exception of the north center), a decrease of the minimum temperature, and an increase of the maximum temperature. That is, we expect slightly colder nights and hotter days. Under a pessimistic emissions scenario (RCP 8.5), the situation varies slightly in terms of magnitude. For quarterly precipitation, this study predicts a generalized increase in precipitation in all quarters, with the exception of areas of the northern center, a situation that is basically maintained even under a pessimistic scenario of GHG emissions.
It is important to emphasize that the future scenarios predicted in this paper differ from those presented by Ecuador in its Third National Communication on Climate Change to the UNFCCC, especially in terms of magnitude. There are two important reasons for these differences. First, and remarkably important, is the use of an appropriate local-level scale of analysis. Second, the current climate data used in this study are somewhat different, as a result not only of the scale of analysis, but also the time period, the database source, and the methodology. The study of the scenarios presented in the National Communication uses the period 1981-2005, considers a total for the whole country of 137 stations with rainfall data and about 30 with temperature data. The methodology used in the present investigation considers in depth the issue of orography and altitude, using a terrain digital terrain model and making corrections for missing data.
This is a critical finding, showing that the magnitude and, in some cases even the direction (+/-), of the expected variations are different depending on which data series/scale is used for present climate.
We are convinced that the best mechanism to confront climate change and increase the adaptation capacity of communities is to provide meaningful predictions at local scales that can be used as the basis for detailed planning. This paper demonstrates both the difficulty and the promise of this approach, pointing toward a need for more research on this topic, conceptually and empirically. For the case of Pedro Moncayo canton, we have produced results that will support the articulation of local mechanisms to deal with the present and future climate conditions. This promises great benefit to those communities living and dealing with climate change.
Acknowledgements
We thank Ecuador’s National Institute of Meteorology and Hydrology (INAMHI) for the providing meteorological information and its Division of Studies, Research and Hydro Meteorological Development for conducting a technical review of this article.
References
Arnell, N., Tompkins, E., & Adger, W. (2004). Elicting information on the likelihood of rapid climate change. Conference on Perspectives on Dangerous Climate Change . United Kingdom.
Arteaga, A., Cáceres-Arteaga, N., & Cáceres, L. (2017). El Acuerdo de Paris sobre Cambio Climático. Ambición, Credibilidad y Factibilidad. Arje Revista de Posgrado FaCE-UC, 304-313.
Berrang-Ford, L., Pearce, T., & Ford, J. (2015). Systematic review approaches for climate change adaptation Research. Regional Environmental Change, 755-769.
Burke, M., Dykema, J., Lobell, D., & Satyanath, S. (2015). Incorporating climate uncertainty into estimates of climata change impacts. Review of Economics and Statistics, 461-471.
Climate Hazard Group. (18 de February de 2018). Data Tools. Obtenido de http://chg.geog.ucsb.edu/about/index.html
Conference of the Parties. (2015). Adoption of the Paris Agreement. Paris.
G Wagner, M. W. (2015). Climate chock. The economics consequences of a hotter planet. New Jersey: Princeton University Press.
Gobierno Autónomo Descentralizado de Pedro Moncayo. (2015). Plan de Ordenamieno y Desarrollo Cantonal del Cantón Pedro Moncayo, Actualización 2015-2025. Tabacundo.
Intergovernmental Panel on Climate Change - IPCC. (2012). Managing the Risks of Extreme Events and Disasters to Advance Climate Change Adaptation. Cambridge and New York: Cambridge University Press.
Intergubernamental Panel on Climate Change - IPCC. (2008). Report of the 28th Sessión of the IPCC. Budapest.
Intergubernamental Panel on Climate Change - IPCC. (2014). Climate Change 2014: Synthesis Report. Contribution of Working Groups I, II and III to the Fifth Assessment Report of the. Geneva.
Meinshausen, M., Meinshausen, N., Hare, W., Raper, S., Frieler, K., Knutti, R., & Allen, M. (2009). Greenhouse-gas emission targets for limiting global warming to 2ºC. Nature, 1158-1163.
Ministerio del Ambiente - MAE. (2014). Acuerdo Ministerial No. 137. Quito.
Ministerio del Ambiente - MAE. (2017). National Communication on Climate Change. Quito.
Nuñez, R. (2016). Asset for health: linking vulnerability, resilience and adaptation to climate change. Warwick: Tyndal Centre for Climate Change Research.
Roy, S. S. (2018). Linking Gender to Climate Change Impactos in the Global South. Coral Gables: Springer.
Smit, B., Burton, I., Klein, R., & Wandel, J. (2000). An Anatomy of Adaptation to Climate Change and Variability. In Y. G. Kane S.M., Societal Adaptation to Climate Variability and Change (págs. 223-251). Dordrecht: Springer.
Stern, N. (2008). The economics of climate change. American Economic Review, 1-37.
United Nations Framework Convention on Climate Change - UNFCCC. (1992). United Nations Conference on Environment and Development - UNCED. Rio de Janeiro.
United Nations Framework Convention on Climate Change - UNFCCC. (2015). Paris Agreement. Bonn: UNFCCC.
Wagner, G. &. (2015). Climate shock. The economics consequences of a hotter planet. New Jersey: Princeton University Press.
1 Natali Cáceres-Arteaga, PhD(c), Universidad Central del Ecuador, Ecuador. dncaceres@uce.edu.ec
2 Ing. Oscar Ayala, Instituto Nacional de Meteorología e Hidrología, Ecuador. oayala@inamhi.gob.ec
3 Ing. Darwin Rosero, Instituto Nacional de Meteorología e Hidrología, Ecuador. drosero@inamhi.gob.ec
4 K. Maria D. Lane, PhD, University of New Mexico, xxxxxxx. mdlane@unm.edu
Este artículo corresponde a la ponencia presentada en el 35th Conference of Latin American Geographers realizada en San José, Costa Rica del 20 al 22 de mayo del 2018.
5 Projection made by SENPLADES, based on the Population and Housing Census, INEC 2010
6 The fifth Assessment Report (AR5) of the IPCC established four possible climate futures, all of which are considered possible depending on how much greenhouse gases are emitted in the years to come. These scenarios, called Representative Concentration Pathways (RCPs) include a scenario of low emissions (RCP 2.6), two intermediate (RCP 4.5 and RCP 6.) and the one with the highest expected emissions (RCP 8.5). The first and the last are referred to as the optimistic and pessimistic scenarios.
7 Refer to footnote 6.
8 Refer to footnote 6.