THE GUANE ACTIVE FAULT, WESTERN CUBA
LA FALLA ACTIVA GUANE, CUBA OCCIDENTAL
THE GUANE ACTIVE FAULT, WESTERN CUBA
Revista Geográfica de América Central, vol. 2, no. 57, 2016
Universidad Nacional
Received: 02 December 2015
Accepted: 19 March 2016
Abstract: The paper presents some new data to confirm the existence and activity of the Guane fault. This is an intraplate active structure of the Western Neotectonic Unit of Cuba with ~100 earthquakes. It has a maximum magnitude value of 6.2 for a time period of occurrence of ~130 years. The tectonic mechanism of intraplate readjustments through faults and block rotations are responsible for the earthquakes on 01-23-1880 (San Cristóbal, Pinar del Río), 12-16-1982 (Torriente - Jagüey Grande, Matanzas), and 03-09-1995 (Pedro Pí - San José de las Lajas, La Habana). These three earthquakes can be explained by the transpression process of the Caribbean and North American plates at Swan and Oriente fault zones, and the stress transmission toward the Cuban mega-block.
Keywords: Cuba, earthquake, fault, intraplate seismicity, seismotectonic.
Resumen: Se presentan nuevos datos que confirman la actividad de la falla Guane. Ésta es una estructura activa de interior de placa en la Unidad Neotectónica Occidental de Cuba con ~100. La magnitud máxima de los terremotos es 6.2 con periodo de recurrencia de ~130 años. El mecanismo tectónico de reajustes en el interior de la placa es a través de fallas y rotación de bloques, que producen terremotos como los de: 23.01.1880 (San Cristóbal, Cuba), 16.12.1982 (Torriente - Jagüey Grande, Matanzas) y 09.03.1995 (Pedro Pí - San José de las Lajas, La Habana). Esos 3 terremotos se pueden explicar a partir de procesos transpresivos de las placas Caribe y Norteamérica en las fallas Swan y Oriente, y de la transmisión de esfuerzos hacia el megabloque Cuba.
Palabras clave: Cuba, falla, sismotectónica, sismicidad de interior de placa, terremoto.
Introduction
This paper follows the ideas proposed in “Study of the earthquake of the January 23, 1880, in San Cristóbal, Cuba and the Guane fault” (Cotilla and Córdoba, 2011) and we present new elements that underline both the existence and activity of the Guane fault [GF] (Figure 1A). We will not repeat the information previously provided regarding the location, tectonic characteristics and seismicity of the area, but we will recall some items that are essential for the arguments presented in this paper and refer our readers to the above-mentioned publication for the details.
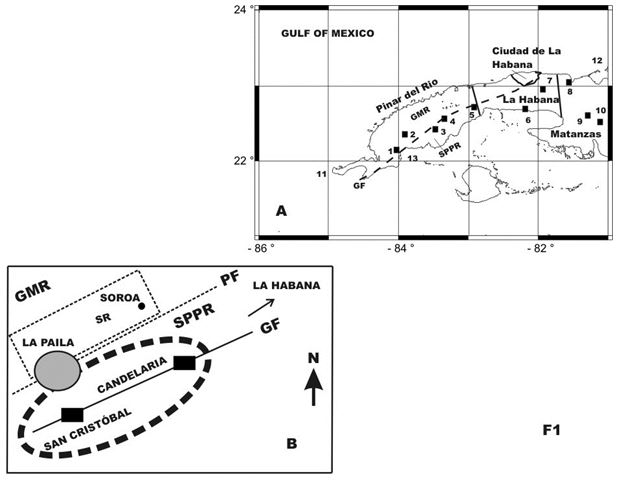
Figure 1.
Pinar del Río and its surrounding
A) Scheme of the Pinar del Río province and its surrounding. In it appears: 1) four administrative provinces of the Western Cuba (Pinar del Río, Ciudad de La Habana, La Habana, and Matanzas) with their boundaries; 2) the Guane fault (GF) in discontinue trace; 3) the localities with black squares (1= Guane, 2= Pinar del Río, 3= Consolación del Sur, 4= Los Palacios, 5= San Cristóbal, 6= Batabanó, 7= San José de las Lajas, 8= Matanzas, 9= Torriente, 10= Jagüey Grande); 4) Sites: 11= Cabo de San Antonio, 12= Punta de Hicacos, 13= Cortés inlet; GMR= Guaniguanico Mountain Range, SPPR= South Plain of Pinar del Río. B) Scheme of the most affected area by 1880 earthquake. The localities are with black squares (San Cristóbal and Candelaria). Black circle= seismic station of Soroa. A black arrow shows the direction to La Habana. The faults: Pinar (PF) in discontinue trace, Guane (GF) in continue trace. GMR= Guaniguanico Mountain Range, SR= Sierra del Rosario, SPPR= South Plain of Pinar del Río. Grey circle the artificial water reservoir La Paila (6.0 km2). Ellipse in discontinue trace is the most affected area.
Cotilla et al. (1991A) were the first to recognize activity in the GF (Figure 1A). They mainly used data from Viñes and Salteraín, 1880 and neotectonic results provided by Cotilla et al. (1991B). The latter authors considered the works of Álvarez (1989, 1981), Butticaz (1946A, B), and Cotilla et al. (1991C) to determine the existence of the GF. Cotilla et al. (1991A) established the GF’s seismotectonic category and estimated the maximum magnitude of its earthquakes. Finally, Cotilla and Cordoba (2011) did a depth review of the 1880 earthquake and studied other earthquakes and the seismic data from the Soroa station (Figure 1B), including new geomorphologic evidences that support activity in the GF.
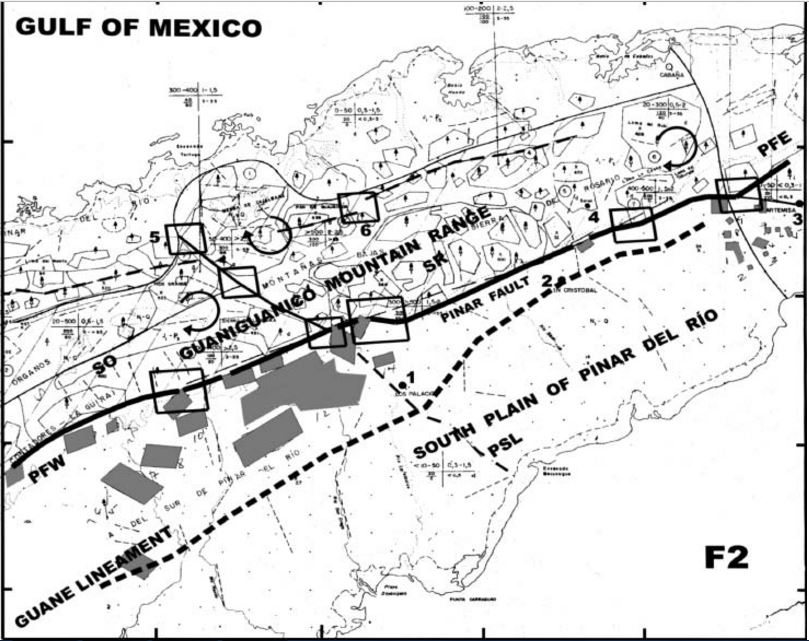
Figure 2.
Western segment of the Cuban Morphostructural map
Fuente: González et al., 2003.
Heavy black line= Pinar fault. Discontinue heavy black line= Guane lineament. Continue and discontinue black line= La Palma - San Diego lineament (PSL). Curve black arrow= sense of block rotation. Rectangle= deformation area. The active and positive morphostructures (figures in gray color) located in the South Plain of Pinar del Río. Localities: 1= Los Palacios, 2= San Cristóbal, 3= Artemisa, 4= Soroa, 5= La Palma, 6= Mameyal. Mountains: SO= Sierra de los Organos, SR= Sierra del Rosario.
The scientific decision and idea of Cotilla et al. (1991A, B) about the GF activity showed a huge controversy in the Cuban scientific community. In appearance the geological picture of the Western region is quite clear due to the existence of the very well defined and aligned Guaniguanico Mountain Range [GMR] (Figure 2), and the associated Pinar fault [PF] (Figure 3B). Cotilla et al. (1991B, C) studied this territory in detail and did extensive work around the towns of La Muralla, San Cristóbal, Candelaria and Soroa. For the first time they divided the PF into 2 segments (1) western [PFW] and 2) eastern [PFE] (Figure 2)) based on the differences between the 2 main sections of the GMR: 1) the Sierra de los Organos [SO]; and 2) the Sierra del Rosario [SR]. The findings with regard to the PF hazard were clear; the seismic potential was reduced and the most dangerous zone limited to the eastern part, the SR. At the same time the authors found signs of another seismic structure, the GF, which was very near to the PF and can be linked to the damage caused in the 1880 San Cristóbal earthquake.
Cotilla and Franzke (1999) calculated a stress tensor for Eastern Cuba. It was the first dynamic result of this area. Cotilla et al. (2007) subsequently identified a regional stress tensor for Cuba with NE-SW striking. This led us to consider the existence of normal and left-lateral strike slip faults, with small pull-apart basins, fault ridges, and push-up and flower structures. These authors identified different segments in the Cuban faults that could explain the existing low earthquake magnitudes (Table 1). The idea is that Western Cuba has a structure of faulting and uneven blocks, with different degrees of mobility and a tendency for vertical displacement. These are, however, interrelated (due to processes not yet understood) in a regional context where left-lateral strike slip is predominant. Blocks show a mix of vertical movement, rotation and tilting. In Western region, there are 8 cells or blocks: CI= Matanzas Este, CII= Matanzas Centro, CIII= Habana - Matanzas, CIV= La Habana, CV= Habana Oeste, CVI= Habana Sur, CVII= Zapata - Cochinos, and CVIII= Cienfuegos (Cotilla and Álvarez, 2001) (Figure 3A). These cells are made up of the following active faults: Cochinos [CHF], GF, Hicacos [HF], Habana - Cienfuegos [HCF], Nortecubana [NCF], and Surcubana [SCF] (Cotilla 2014; and Cotilla et al., 2007). We linked the majority of these faults to earthquakes (GF= 21, CHF= 21, HF= 14, HCF= 31, and NCF= 4) (Figure 3A). We also found 8 knots where the fault intersections are located (N1= Bahía de Cienfuegos (3 events, Imax= 4.5 MSK), N2= Torriente - Jagüey Grande (3 events, Mmax= 5.0), N3= Güines (1 event, Imax= 5 MSK), N4= San José de las Lajas (3 events, Mmax= 2.5), N5= Bahía de La Habana (13 events, Imax= 5), N6= Bahía de Matanzas (2 events, Imax= 5), and N7= Hicacos, N8= Bahía de Cochinos (5 events, Imax= 4)) (Cotilla and Álvarez, 2001).
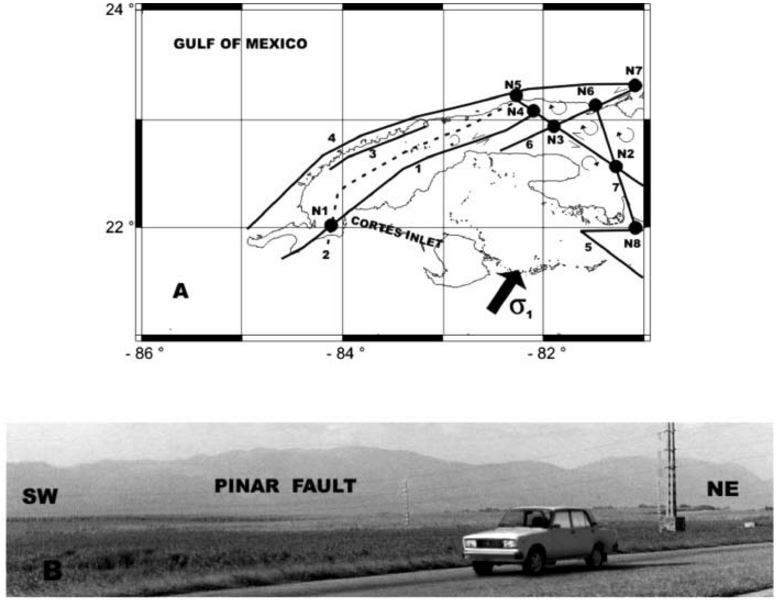
Figure 3.
Western Cuba
A) Simplified model of cells and stress tensor of Western Cuba.
Black lines are faults (1= Guane, 3= Consolación del Norte, 4= Nortecubana, 5= Surcubana, 6= Hicacos, 7= Cochinos); 2= Pinar fault is in discontinue trace; black circles= knot of faults (N1= Guane, N2= Torriente - Jagüey Grande, N3= Güines, N4= San José de las Lajas, N5= Bahía de La Habana, N6= Bahía de Matanzas, N7= Hicacos); heavy black arrow= main stress (ρ1); curve black arrow= sense of movement with code.
B) View from the South Plain of Pinar del Río to the Pinar fault (area of Sierra del Rosario).
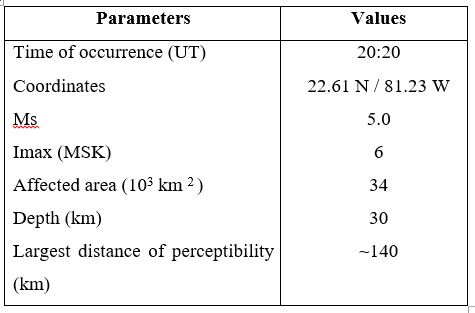
The 1880 earthquake occurred very close to the towns of San Cristóbal [SC] and Candelaria (Figure 1B, Table 2), which are ~10 km apart. At that time the majority of the citizens were from the Canary Islands and Cádiz (Spain), and also from France. Politics and economics were under the influence of a large war that was being waged against King Alfonso XII de Borbón (28.11.1857-25.11.1885). The maximum political figure in Cuba was Ramón Blanco y Erenas, the Marquis of Peña Plata (April 1879-1881), who ordered and supported the research done by Viñes and Salteraín (1880). The main economic activities in the region were sugar cane and coffee plantations, which were run using slaves. The total number of slaves in Cuba reached ~700,000 with Pinar del Río having ~6,000 (Balboa Navarro, 2010). It is important to note that: 1) from 09.06.1878 Cuba was divided into 6 provinces; 2) one of them was Pinar del Rio; 3) this in turn was divided into 25 municipalities (for our purpose we quote: Candelaria, Cayajabos, Los Palacios, San Cristóbal, and San Diego de los Baños. They were all affected by the 1880 earthquake); 4) rail service reached Candelaria in 1868 and Consolación del Sur in 1880 from La Habana; 5) in the middle of the 19th century many French settled in the towns of Candelaria, San Cristóbal and Artemisa to cultivate coffee; 6) slavery was abolished on 07.10.1886 by Queen María Cristina de Austria; and 7) currently, San Cristóbal and Candelaria have ~90,000 inhabitants (in Cuba the total population is ~10 million). Thus, it is of utmost importance to determine which faults can generate strong earthquakes and how dangerous they may be. This is the main aim of the study.
Neotectonics and seismicity
Cuba is a mega-block in the southern part of the North American plate (Figure 4A). According to Cotilla et al. (1991B), the mega-block comprises 2 Neotectonic Units, the Western unit [Wnu] and the Eastern unit [Enu], which are separated by the Cauto - Nipe [CNF] transverse-diagonal active fault (NE-SW). An active plate boundary runs along the Cuban south eastern coast where the Plate Boundary Zone [PBZ] is located and related to Oriente fault [OF]. Two types of seismicity were identified: a) interplate (or plate edge); and b) intraplate (the Western region). Intraplate earthquakes occur across the whole island and in the adjacent marine area outside of the PBZ. They are significantly weaker and less frequent than the interplate events.
Some strongest earthquakes of the Western Neotectonic Unit
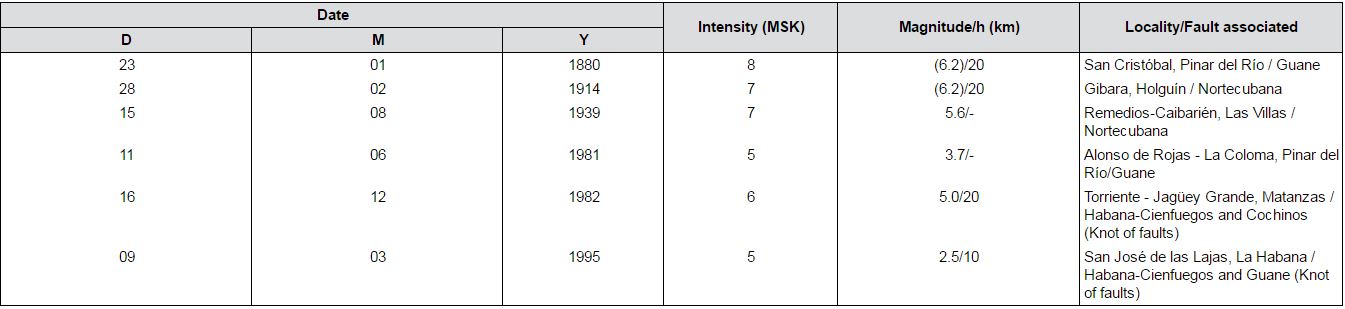
.
Note: The numbers in parentheses indicate determinations as from macroseismic data.
Data of three villages of Pinar del Río province
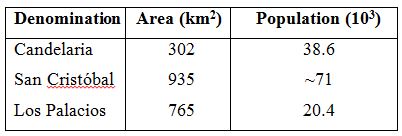
The Wnu has displayed relatively homogeneous neotectonic activity from the Upper Eocene to the present. A system of blocks was formed and the transverse fault system was radically modified. In particular, 2 extensive and heterogeneous active fault systems are in the marine section. They constitute the northern and southern limits, respectively, of the Cuban mega-block. The Wnu extends from Cabo de San Antonio (west edge of Cuba) to the Cauto - Nipe depression (Figure 4A). Sectors of neotectonic uplift are considerably less numerous than in the Enu, and there are large areas where they do not even appear. The maximum uplifted movements in Wnu are ~300 m in the GMR (hmax= 671 m).
Makarov et al. (2007) explained that linear structures that are visible from space in the ground and platform actually exist and can be defined as lineaments. They are of diverse origin but from a neotectonic standpoint and can be active zones. This is the case of the northern and southern borders of the Cuban mega-block. Looking at a map of Cuba it is possible to see the change in the configuration of its northern coast, in terms of its layout relative to the North American continent. This change can be seen from Cabo de San Antonio to Punta Hicacos, with a SW-NE alignment, and from Punta Hicacos to Punta de Maisí, NW-SE (Figure 4A). These 2 segments are associated with the NCF. They are called: 1) Western (~300 km); and 2) Centre-Eastern (~800 km). We believe that this change is a result of the Pre-neotectonic evolution and the collision with the Gulf of Mexico and the Bahamas platforms, respectively. These elements obviously influenced the shaped of the relief and faulting, for example, the GF with a SW-NE strike (~300 km) and the HCF with a NW-SE strike (~310 km) (Figure 3A).
Relevant international researches have been conducted on water reservoirs by their relations with the earthquakes. Recently, Smirnov et al. (2013) studied the Koyna - Warna water reservoirs in West India, which in 2000 was hit by 2 earthquakes (M> 5). These authors maintain that the stress level was close to critical and insignificant variations in the water level triggered the earthquakes. According to Álvarez (1992, 1989, 1981) the PF is part of the GF (Figure 3A). Seven artificial water reservoirs are located over the PF. Three of them are very close to the town of San Cristóbal (Figures 1B and 5A, 5BC). If the PF were responsible for the 1880 earthquake these reservoirs could be damaged in a future event and could even collapse. Thus, the villages located in the south have a very high risk. Tables 3 and 4 contain data for 2 dams in Pinar del Río and several others in different parts of Cuba (de las Cuevas Toraya, 2001; Díaz Arenas, 1989; and Martínez Rodríguez, 2003) showing the huge volume of water reached after 1959.
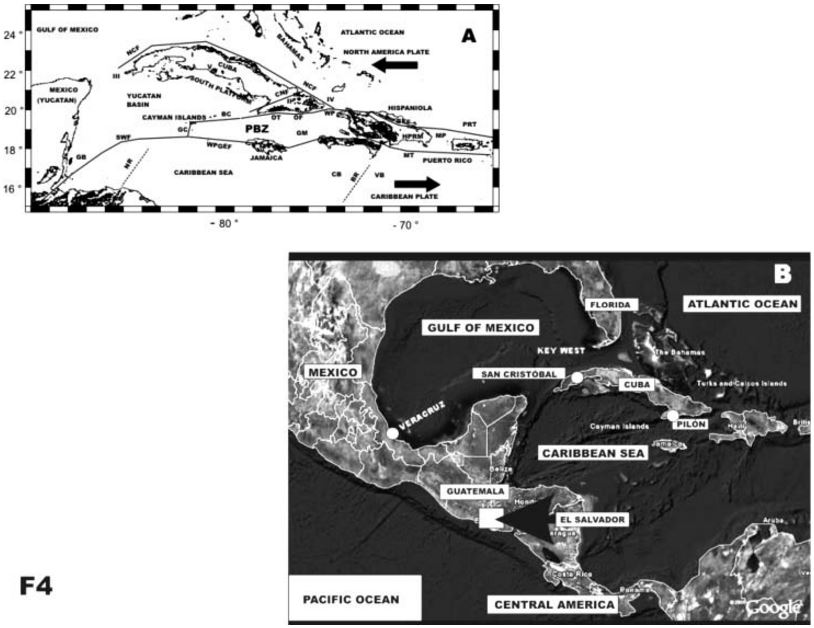
Figure 4.
Schemes of the Caribbean
A) Tectonic scheme of the Caribbean. Heavy black arrows show the sense of the plate movements. With points trace appear the ridges (BR= Beata, NR= Nicaragua). Other structures are: 1) the main faults (BC= Bartlett - Caimán, CNF= Cauto - Nipe, NCF= Nortecubana, OF= Oriente, SEF= Septentrional, SWF= Swan, WPGEF = Walton - Plantain Garden - Enriquillo); 2) passages (MP= Mona, WP= Windward); 3) islands (Cuba, Hispaniola, Jamaica, Puerto Rico); 4) basins (CB= Colombia, GB= Guatemala, VB= Venezuela); 5) microplates (GM= Gonave, HPRM= Hispaniola - Puerto Rico); 6) troughs (MT= Muertos, OT= Oriente, PRT= Puerto Rico); 7) PBZ= Plates boundary zone; 8) Neotectonic Units (I= Western, II= Eastern); 9) Sites (III= Cabo de San Antonio, IV= Punta de Maisí, V= Guamuhaya Mountains). B) Image from Google map (2013) of Caribbean - Central American region. Appear: a) Circles: Veracruz, México; San Cristóbal, Cuba; Pilón, Cuba; b) Rectangle: El Salvador.
Recent data for blasting operations in the mountains of the SR to obtain construction materials such as limestone (calcareous stone) show the following annual information: 2008 (228.106 m3), 2009 (~217.106 m3), and 2010 (~182.106 m3) (de las Cuevas Toraya, 2001; and Oficina Nacional de Estadísticas de la República de Cuba, 2010). It is evident that blasting can increase the seismic hazard for the 2 towns mentioned above.
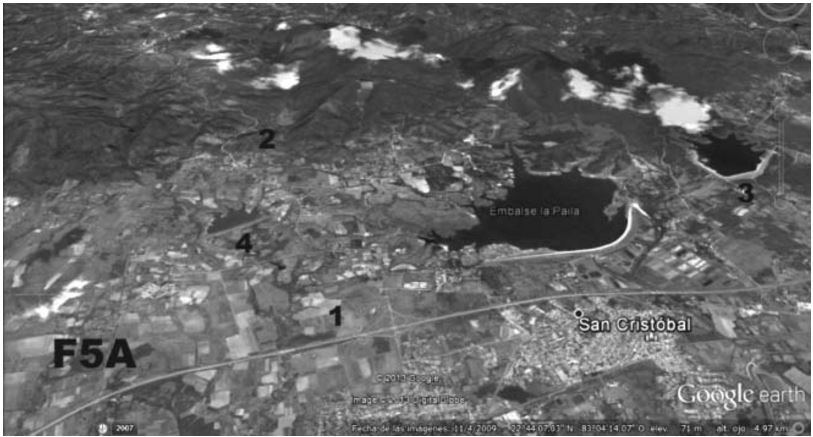
Figure 5.
San Cristóbal and Candelaria areas
A) Image from Google map (2013) of San Cristóbal area.
Appear: a) three artificial water reservoirs in the northern of San Cristóbal (La Paila (6.0 km2), 3, 4); b) the highway La Habana - Pinar (1); localities (San Cristóbal, La Muralla (2)).
Image from Google map (2013)
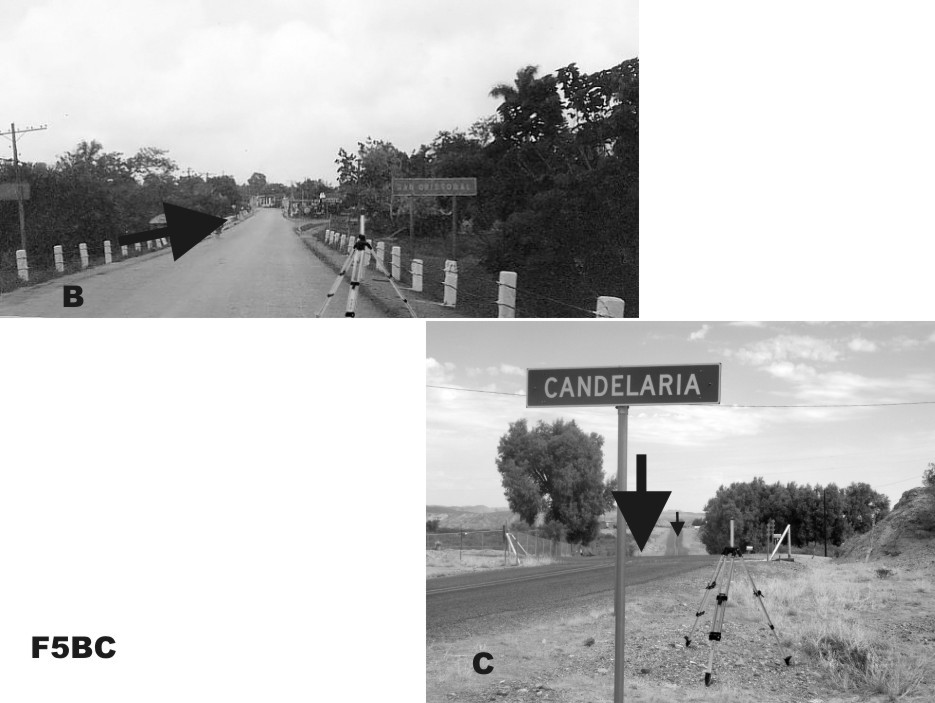
5B y 5C
B) Entrance of the San Cristóbal town from Candelaria.
This town is over the South Plain of Pinar del Río and was destroyed by the 1880 earthquake.
C) View of the Candelaria town.
This town is also over the South Plain of Pinar del Río and very near to Soroa seismic station. Heavy black arrows indicate two parallel fractures to the GF.
Data of some Pinar del Río water reservoirs
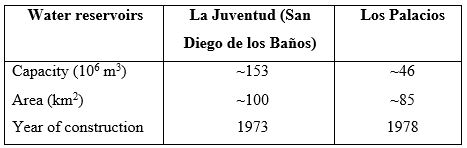
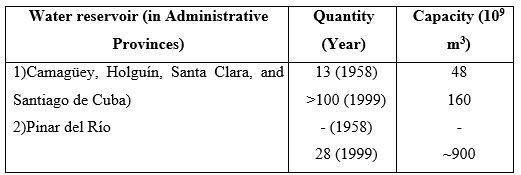
Table 4.
Data of the Cuban water reservoirs
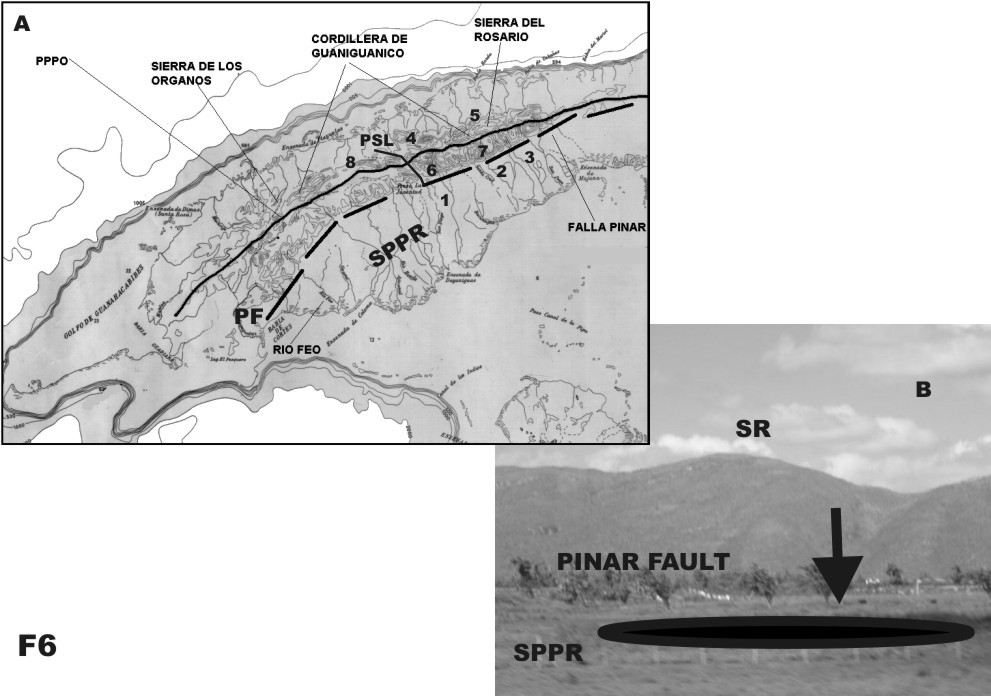
Figure 6.
Geomorphic characteristics
A) Scheme of the fluvial network of Pinar del Río (Cotilla et al., 2003).
Localities: 1= Los Palacios, 2= San Cristóbal, 3= Candelaria, 4= Mameyal, 5= Quiñones, 6= Las Tranquilidad, 7= La Muralla, 8= La Palma. Black line: a) continue trace: Main divide of the superficial waters (PPPO), b) discontinue trace: Pinar fault (PF) and La Palma-San Diego lineament (PSL). SPPR= South Plain of Pinar del Río.
B) Location of a sag pond in the alluvial plain of Pinar del Río.
Heavy black ellipse and an arrow over the ground indicate the location and figure of the sag. It is 500 m to W of the Galope ruins. Sites: SR= Sierra del Rosario, SPPR= South Plain of Pinar del Río.
The morphology and morphometry of the Sierra Maestra Mountains Range [SMR] in Enu is quite different from the mentioned before GMR, and particularly from the SR (Cotilla et al., 2007, 2003, 1993, 1991B). Also, neotectonic activity is higher in the SMR than in the GMR. The GMR shows important differences in morphology and structure. The western part, the SO, has a SSW to NE main axis and the SA [SA] is very low. In contrast, the mountains of the SR have higher hypsometric values than the SO. The SR also has several fractures, veins, and inflection points that affect surface drainage (basins, tributaries, and main rivers). The morphology is very different on its southern and northern flanks (Figure 2). The northern border is irregular (similar to an arc) with elevations and plains at different altitudes. The rivers that run toward the N coast have important inflections to the E (Figure 6A). In contrast, the southern border presents an impressive linear mountain front that is associated with the PF (Figures 2, 3B and 6A). The main rivers on this side run toward the south and present different profiles, forms and structures (Table 5) (Cotilla et al., 2003).
Morphologically, the PF divides the GMR and the South Plain of Pinar del Río [SPPR] (Figures 2 and 3B). It is the tectonic limit between Cr2 rocks in the south and the San Cayetano Formation (J1 – J3 ox) in the north. The fault is observed in the relief that runs from Bahía de Cortés to near Mariel or La Habana (Figure 6A). The SW-NE profile is always visible as a scarp to the south of the morphostructures (Figure 2). This strike coincides with the region’s main water divide (Figure 6A). Cotilla et al. (1993) conducted several field trips along the PF and across the SR (Figures 2, 3A, B, 5A and 6A). They mainly studied 5 profiles: 1) Candelaria - San Diego de Nuñez; 2) La Tranquilidad - Mameyal - La Palma; 3) La Muralla – Quiñones; 4) San Diego de Nuñez - Casablanca - Ciro Redondo; and 5) San Diego de los Baños - Cayajabo. They found and documented several outcrops, deformations and collapsed hillsides. Rocks were also found with lineation, slickenside striation, veins, shear fractures, and joint systems. Some of the areas studied are indicated with rectangles in Figure 2. The great majority of relief anomalies where found inside the SR (Figure 1B), but they were all classified as ancient and inactive (Cotilla and Córdoba, 2010A; and Cotilla et al., 2007). Using morphostructural, neotectonic and seismic data (Cotilla and Córdoba, 2011; and Cotilla et al., 1993) maintained that the PF is not active. Also, we indicated the clear and deformed NW-SE limit between the SO and the SR mountains (Cotilla et al., 1991C; and González et al., 2003) (Figure 2), which is also visible in the fluvial network (González et al., 2003) (Figure 6A). We called this zone of lineaments La Palma - San Diego [PSL] (see Figure 4 of (Cotilla et al., 1993). The strike is not exceptional because others are also located in CHF (Wnu) and Baconao fault (Enu). On the both sides of the lineament we identified several block tills, deformed fluvial basins and terraces, and changes of the main tectonic strike. This allows us indicate three block rotation systems (Figure 2). The lineament split the PF at an acute angle. The interception area is very near to the La Juventud dam. The layout of the PSL is also observed in the SPPR and 2 different morphotectonic fields are defined: 1) western (south of the SO) where some morphostructures can be found; and 2) eastern (south of the SR) where practically none exist (Figure 2). This lineament is quite important for explaining: 1) the changes of morphology, strike, and activity of the PF, as we mentioned before we divided the PF in 2 segments; and 2) the counter block rotations and the possibility of a dynamic set of cells (Figure 3A).
The GF (~280 km long) and the PF are spatially analogous to the strike of the NCF. They are NE strike faults and parallel to the western segment of the NCF. The epicenter of the strongest earthquake (28.01.1880) was situated at SC, Pinar del Río province (Table 6) (Cotilla and Córdoba, 2011; and Viñes and Salteraín, 1880). We present 3 earthquakes of Enu (Table 7) in order to compare the GF activity with the PBZ where the major values of the neotectonic intensity and recent crustal movements occur.
Some data of the main rivers in Sierra del Rosario
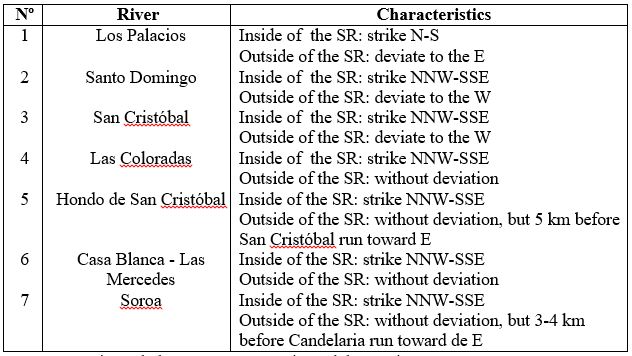
Note: SO: Sierra de los Organos, SR: Sierra del Rosario.
The HCF is a large SE-NW structure (~ 230 km long) of the Wnu (Cotilla et al., 1991C). The 1982 earthquake (Ms= 5.0) that hit Torriente - Jagüey Grande [TJG], Matanzas (Figures 3A and 7A, Tables 1 and 8) (Chuy et al., 1983) is associated with this fault and we found that the macroseismic epicenter (22º 37’N / 81º 14’ W) was at the intersection of the HCF with CHF (knot N2, Figure 3A) (Cotilla et al., 1991C). In 1995 another earthquake was registered (Ms= 2.5) and was felt at Pedro Pí - in the region of San José de Lajas (PP), La Habana (Figure 3A, Table 1) (González et al., 1995). This event also took place on the HCF, but farther to the NW, where we found another intersection of the HCF, but in this case with the GF (Cotilla, 1995). The isoseismal map by González et al. (1995) showed that the main perceptibility was toward the NW. Thus, the earthquakes in TJG and PP may support the idea that earthquakes in Wnu take place at the intersections of different active structures (knot N3, Figure 3A) (Cotilla and Álvarez, 2001). The idea that earthquakes are located at fault intersections was previously published by various authors such as Guelfand et al., (1976) and Zhidkov et al. (1975). We believe that this favors block composition, block rotation, and the transmission of the stress, with the resulting seismic energy release.
Cotilla and Álvarez (2001) (see their Figure 7) suggested that the GF and the HCF are interconnected active structures. Also, the strike, geometry and activity of these faults can be explained by the presence of 2 large depressed oceanic structures, the Gulf of Mexico and the Yucatan Basin (Figure 4A), which are opposed in the contemporary tectonic stress field, mainly caused by the influences of the plate system Caribbean, Cocos and North American. We found similar explanation for SA in the Eastern Gulf of Mexico (USGS, 2006). In this area 2 earthquakes occurred (10.02.2006, M= 5.2; and 10.09.2006, M= 5.8), with the second having a mixed type focal mechanism with a fault plane of ~300º NW-SE. This strike coincides with the NCF and these epicenters are ~600 km from La Habana. Cotilla (2014, 1999) reached the same conclusion based on seismicity and tectonic data from the Gulf of Mexico by Frohlich (1982) and LeRoy (1998).
The seismically active Bartlett - Cayman fault system has 2 sectors (Figure 4A): Swan and Oriente (Cotilla and Udías, 1999). This is the limit of the Caribbean and North American plates and is related to structures such as the Yucatan Basin (Erickson et al., 1972; Rosencratz, 1990; Rosencratz and Mann, 1991; and Rosencratz et al., 1988). The behavior of its SA is different from ocean diverging systems (Cotilla et al., 1997, 1992) where the plate slip is virtually aseismic, although a high level of heat is released. In contrast, the Caribbean - North American system has a moderate to high SA and low thermal anomalies. Moreover, transform faults in oceanic crust tend to be pure strike-slip, but in island arcs and continental areas they play a part in the accommodation of divergent and convergent zones producing transpressive and transtensive zones (Johnston and Kanter, 1990), which is the actual situation in the Caribbean.
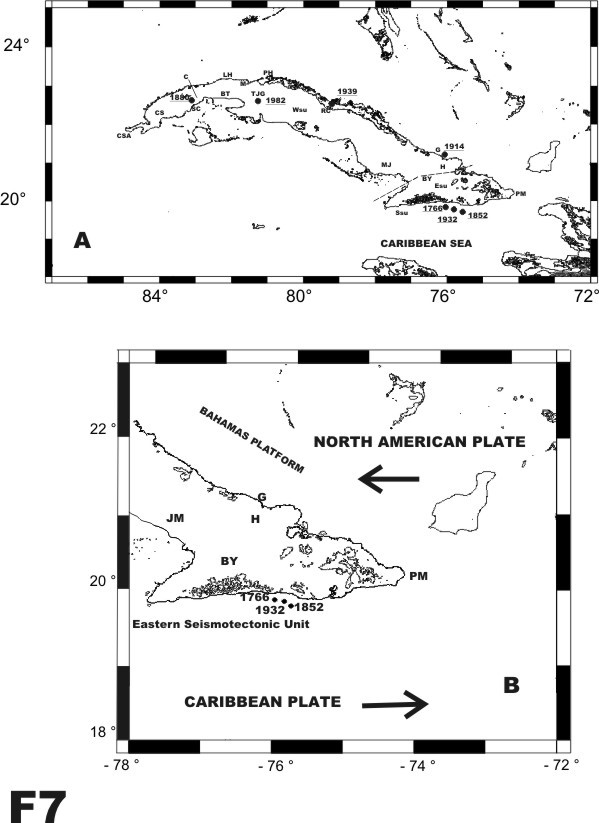
Figure 7.
Cuban earthquakes
A) Selection of strongest earthquakes and some localities.
Black circle= epicentre. See tables 1 and 8. Localities: BT= Batabanó, BY= Bayamo, C= Candelaria, CS= Consolación del Sur, G= Gibara, H= Holguín, LH= La Habana, M= Matanzas, MJ= Minas de Jobabo, PM= Punta de Maisí, RC= Remedios - Caibarién, SC= San Cristóbal, TJG= Torriente - Jagüey Grande.
B) Selection of strong earthquakes of the south eastern Cuba.
Heavy black arrow= Sense of plate movements. Localities: BY= Bayamo, G= Gibara, H= Holguín, MJ= Minas de Jobabo, PM= Punta de Maisí. Black circle= epicentre and year of occurrence. See table 7.
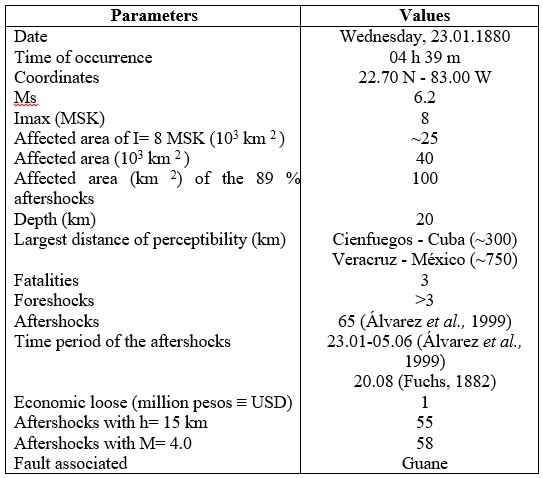
Data of the San Cristóbal earthquake
Following the proposals by Cotilla and Udías (1999) we affirmed that the stress transmission is easier northward in the sector of RC [Remedios – Caibarién] - G [Gibara] than in the sector of SC from the Caribbean - North American plate boundary (Figure 4A). These 3 sectors belong also to the Wnu and are related to strong earthquakes. Thus the release of energy in the form of strong and weak earthquakes also occurs at the northern edge of the mega-block, specifically in the NCF, but in its Centre - Eastern segment. Weak earthquakes occur inside the island, where the following faults are located: Baconao, Camagüey, Cubitas, HC, Las Villas, La Trocha, Santa Clara, and Tuinicú. While strong and weak earthquakes occur in the GF, and only weak earthquakes take place in the NCF western segment. To explain these differences we need to consider that the stress transmission comes from the 2 mentioned parts of the plate boundary (Swan and Oriente) (Figure 4A). This transmission takes place through 2 different structures, the South Platform of Cuba and the Yucatan Basin, respectively. The Yucatan Basin has records from the Late Cretaceous to the Paleogene affected by the Neogene strike-slip in the Caribbean - North American region. Also, the distances are different: a) Swan - NCF= ~430 km; b) OF - NCF= ~300 km.
Seismotectonic discussion
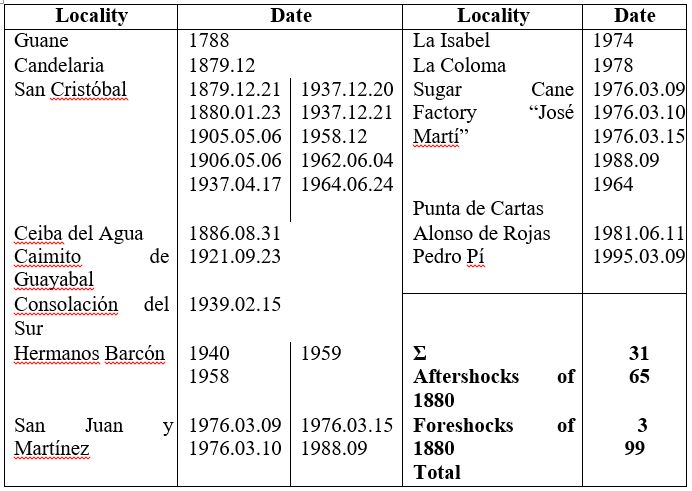
Cotilla and Córdoba (2011) studied the SC earthquake, which was a seismic series that lasted from 21 January to 20 August 1880. They exposed that the data from the various sources was different and sometimes contradictory. Several works in the literature deal with this event (Chuy, 1989; Fuchs, 1882; Orbera et al., 1990; Rockwood, 1880; Taber, 1922; Viñes and Salteraín, 1880; and Wooters, 1986). Reports are also available from print media in: 1) Cuba (Diario de La Marina, Diario de Cienfuegos, Diario de Matanzas, La Voz de Cuba, and La Discusión); 2) the United States (New York Herald); and 3) Spain (several personal letters between Spanish families) (Cotilla, 2007). Álvarez et al. (1999) looked at 65 aftershocks. However, they did not consider the strong aftershock of 20 August (Fuchs, 1882; and Rockwood, 1880). Six other elements that received no mention in recent publications include: 1) Guane town (initially called Guani) and some historic aspects. It was colonized in 1596. Hernán Cortés Monroy Pizarro Altamirano reached the Cuyaguateje River, near Guane, in 1518 (an inlet and a little town bear his family name, Cortés). A few days later he traveled to México. In 1770 a sturdy catholic church was constructed in Guane, but it was completely destroyed by an earthquake in 1788 (González Bacallao, 2003); 2) the sure perceptibility in Veracruz, México of the 1880 SC earthquake (Fuchs, 1882); 3) the possibility that the SC event was induced by seismic and volcanic activity in El Salvador (Fuchs, 1882) (Figure 4B), that we discard; 4) the second largest coffee plantation of Cuba called Angerona is located in the SPPR, Artemisa area. The Galope ruins (in Bayate area) are only 15 km away to the NE. However, the coffee installations were not damaged by the 1880 earthquake. The majority of the coffee plantations belonged to French people; 5) the Spaniards military fortifications in Majana - Mariel were practically not affected (Cuevas, 1900); and 6) the seismicity reported on the GF: a) one event in Alonso de Rojas, Caimito del Guayabal, Candelaria, Ceiba del Agua, Consolación del Sur, Guane, La Coloma, and La Isabel; b) three events in Hermanos Barcón; c) four events in Central “José Martí” and San Juan y Martínez; and d) ten events in SC. All these elements are taken here into consideration.
The accuracy of the mentioned Veracruz earthquake perceptibility is in direct relation with the history and development of the village. It was founded by Hernán Cortés in 1518 and was the first city in Continental America to have a council (10.07.1519). The city had ~10,000 inhabitants in 1878, when the total population of Mexico was approximately 9.5 million people (Secretaría de Economía de México, 1956).
With regard to the possible influence on Pinar del Rio of the seismic and volcanic activities in the Ilopango region (El Salvador, from 21.12.1879 to approximately late March 1880 about one thousand earthquakes were reported) (Figure 4B) there are not really data. The activity started at approximately 05:00 morning on 23.01.1880. There was a tremendous explosion and 2 large lava domes, over 40 m across, emerged from the lake. The distance between Ilopango and San Cristóbal is ~2,000 km. A similar idea was put forward by Álvarez et al. (1984) to explain the earthquake of February 1976 in Pilón (Enu) (Figure 4B) which occurred some days after of the great earthquake of 04.02.1976 in Guatemala. However, we believe that there are other more believed tectonic explanations for this.
The French experience gained with the strong earthquakes in Haiti was useful when designing houses and coffee factories in Cuba (Cotilla, 2007). There are 2 possible explanations for the minimal damage in the Angerona plantation mentioned earlier: 1) the good quality of the construction; and 2) the relatively large distance (~20 km) from the SC epicenter in 1880.
The mentioned 1788 Guane earthquake occurred 92 years before the SC earthquake and 192 years after the town was founded. Guane is located ~135 km SW of SC. Cotilla et al. (1991C) believed that an active knot of faults is located in Guane (number 2 in their Figure 3). Cotilla and Álvarez (2011) also reached the same conclusion (N1 knot in Figure 3A). The active N4 knot (Pedro Pí associated to the earthquake of 09.03.1995) is located at the other end and the distance between SC and PP is ~100 km. Hence, it is possible to consider that the seismicity of the GF is caused by fault segments and knots (Figure 3A).
Sykes (1978) observed that intraplate seismicity areas are located throughout pre-existing tectonic weakness zones, and the GF is an example (Cotilla and Córdoba, 2011). Zoback (1992) showed that horizontal compressional stresses can be transmitted over great distances through the continental and oceanic lithospheres. Also, Van der Plujim et al. (1997) suggested that continental interiors registering plate tectonic activity and intraplate fault reactivation (and earthquake triggering) are mainly dependent on the orientation of fault zones relative to the plate margin, and that deformation of continental interiors can be represented by relatively simple rheological models. Using these arguments and mentioned authors and the results of Johnston and Kanter (1990), Liu and Zoback (1977), Sbar and Sykes (1973) and Stein (1999) we can say that: 1) the tectonic forces of the plate margins can be transmitted inside the plates for up to distances of 2,000 km; 2) the status of the forces in the interior continental zone seems to be relatively independent of the immediate surroundings, as well as of the previous tectonic style; 3) there is a predominance of transmission of energy from the borders toward the interior of the plate; and 4) intraplate seismic events occur in areas where the crust has been weakened by previous activity. Therefore, if we apply these arguments to Wnu we can conclude that earthquakes have taken place here.
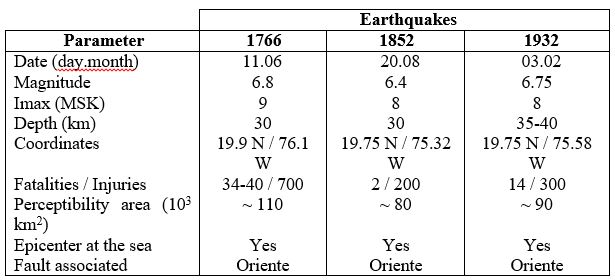
Selected data of three Cuban south eastern earthquakes
The interaction of the Caribbean and North American plates is reflected in the differential SA of the Cuban territory (Cotilla et al., 1997, 1991A). This was one of the arguments for the differentiation of the Cuban Seismotectonic Province into 3 units: South-Eastern [Ssu], Eastern [Esu], and Western [Wsu] (Figure 7A) (Cotilla et al., 1991A). The first one is in the contact zone of the mentioned plates through the OF, where the strongest and most frequent earthquakes take place (Table 7). The other 2 units, much farther away from the plate contact area, and at an acute angle caused by the differential influence, demonstrate an intraplate seismicity of weak and moderate earthquakes, with periods of occurrence greater than 100 years (Cotilla et al., 2007).
At first, not all seismic events occur at plate boundaries. Also, the majority consider that intraplate earthquakes do not pose a significant hazard. Nevertheless, these earthquakes produce widespread damage, but have long recurrence periods (Cotilla, 2007). This is the case of the Wnu region with the 1880 earthquake in SC. There have been at least 100 significant earthquakes in 127 years (Cotilla and Córdoba, 2011).
The author was very surprised when he found 2 topographic maps of Cuba created by Pichardo (1872, 1855). We digitalized and compared them with newer maps made by Cuban specialists (20th century) and found that the old maps were of very high quality (~82 % confidence). Using both types of materials we traveled to the places, mentioned by Cuevas (1900) and Viñes and Salteraín (1880), and concluded that these specialists used the Pichardo maps in their field work.
Viñes and Salteraín (1880) created a scientific procedure to associate an earthquake to a fault. Subsequently, Cotilla (2014), Cotilla and Córdoba (2010A) and Cotilla et al. (2007) have shown that the limited knowledge of active faults in Cuba and the sparse seismic network have had a negative influence on seismotectonic and seismic hazard studies. In previous papers we have also discussed, perhaps without much success, the enormous importance of Cuban historical documents and in particular their relationship with faulting. With this in mind we have searched the Indies Archive in Sevilla (Spain) for information on the strongest earthquakes (Cotilla, 2003; and Cotilla and Córdoba, 2010B, C, 2008).
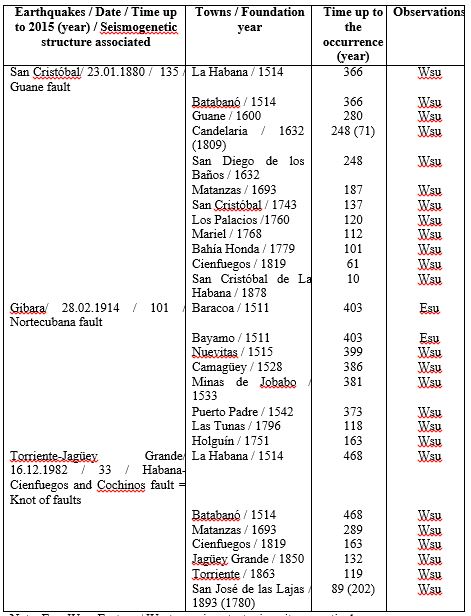
We were looking for other ways to justify periods of occurrence for the intraplate area. Table 8 shows the temporal relationship between the foundation of towns and villages and three earthquakes of the Wnu (1880, 1914, and 1982). In particular the SC earthquake occurred 366 years after the founding of La Habana and 143 years after SC was established; the G earthquake occurred 403 years after Bayamo was established and 163 years after the founding of Holguín; and the TJG earthquake occurred 468 after Batabanó was established and 289 years after the founding of Matanzas. We know that: 1) the earthquakes of SC, G and RC are associated with faults; 2) the G and RC earthquakes are associated with the same fault (NCF); and 3) the earthquake of TJG is associated with a tectonic knot. While taking into account the strongest earthquakes (1880, 1914, and 1982) of the Wnu (Tables 1 and 8) we get: 1) the average period of occurrence is 34 years; 2) the longest period of occurrence was between the SC and TJG events (~100 years), whose epicenters are ~200 km apart; 3) the periods of occurrence to the present for SC and G earthquakes are 135 and 101 years, respectively. These values are in line with expectations for an intraplate area; 4) at the time of this writing the last earthquake was 33 years ago; and 5) the occurrence of a similar event in the near future is feasible based on this data.
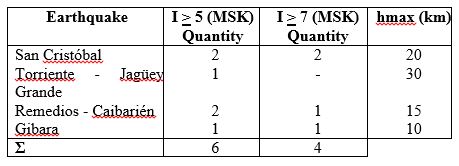
From a statistical point of view the 08.05.1906 SC earthquake (Ms= 5.7 / I= 7 MSK / h= 30 km) could be considered “strong”, although actually it was not. This event occurred 26 years after of the 1880 earthquake. From 1906 to the present 109 years have gone by and the occurrence of a strong event (of the same order of magnitude) is thus likely in the near future. Furthermore, the seismicity data from the Wnu should be taken with caution because of the low number (<6) of earthquakes with seismic intensities of between 5 and 7 (MSK) (Table 9). The main depth interval is 10-30 km (Table 9) and the largest magnitude 6.2 (Table 1). This magnitude only was determined in 2 zones: a) SC (Western Cuba); and b) G (NE of Wnu) (distance of 825 km) (Figures 7A, B).
The Wnu shows different values of SA by sectors and segments (Cotilla, 2007; and Cotilla and Álvarez, 2001). At first, SA in the NCF is higher in the Centre - Eastern segment (2 strong earthquakes in G and RC) than the Western one (one strong earthquake of 6.2 in SC) (Cotilla et al., 2007, 1991A). Differences are apparent in these 3 earthquakes: 1) the westernmost event occurred in the GF (inside the Wnu); and 2) the other 2 events took place in the NCF (on the outer limits of the Wnu). A set of S-N profiles of the SA in the Wnu showed that: 1) the Western sector has a higher value at the GF and is lesser toward the NCF segment; and 2) the Centre - Eastern sector has the highest values in the NCF which diminish as you move south where some faults are located (B, CA, CU, LT, LV, ST, and TU) (Figure 5 of Cotilla et al., 2007). We thus conclude that: 1) the influence of the plate interaction is transmitted differently toward the north and explains the activity of the faults in the Wnu; 2) the Centre - Eastern sector is more active than the Western one; and 3) the GF is the most active section inside the Wnu.
Selection of earthquakes data
Note: Esu, Wsu: Eastern / Western seismotectonic unit, respectively.
Data of the earthquakes (I> 5 and I> 7, MSK) in the Western region
The main characteristic that defines an active fault is the motion and the presence of a rupture surface. Lay and Wallace (1995) consider that an active fault is any structure that presents a fracture and has a differential displacement with respect to adjacent materials located along the plane of a fracture. The GF has no such visible characteristics, but Allen (1975) explained how to associate fault and seismicity, which is what Cotilla and Álvarez (2001) did with the GF. Reiter’s definition of a seismically active fault states that it is always related with the occurrence of at least one earthquake (Reiter, 1990). Along the GF there have been at least 100 earthquakes. Makarov and Schukin (1976) also presented some ideas about active faults that are not expressed in the relief using remote sensing. Cotilla et al. (1991C) used this tool to reveal these structures in Cuba. Later, NUREG - 1451 (1992) stated that an active fault should: 1) demonstrate displacements in the Quaternary; 2) have a correlation with seismicity; and 3) possess a structural relationship with other faults in which relative displacement and a favorable orientation to observable fields of tectonic forces are identifiable. This is applicable to the GF because the localities of Guane, SC and PP were all shaken by SA. Machette et al. (1991) and Trifonov and Machette (1993) considered that active faults are those with activity in the Holocene and the Upper Pleistocene. In this case the GF has recently been active for 203 years (1788-1995). Trifonov and Kozhurin (2010) affirmed that geological - geomorphic methods are the main tools for studying active faults. This idea was applied by Cotilla et al. (1993) to the GF and the PF and the conclusion was that the first one is an active structure. According to Hatter et al. (1993) a fault, a zone of faults, or system of faults is considered active if one or both of the following elements is true: 1) the faulting can be linked to at least one earthquake through direct observation; and 2) the earthquakes or micro-earthquakes take place and have a suitable spatial location near a known fault. Based on the above arguments Cotilla (2014) and Cotilla and Córdoba (2011) stated that the GF is seismically active. Makarov et al. (2007) created a short but powerful definition of active zones, “zones of recent (modern) tectonic activity”, which is the case of the GF.
Mackey et al. (1997) used seismicity to find a block fault structure and Cotilla and Córdoba (2011) applied the same approach to the GF. The following data was also used to the same purpose: 1) the magnitude (6.2) of the SC earthquake is quite similar to the G earthquake in Holguín (Figure 7A, Table 1), with both being located in the Wsu; 2) the SC and G earthquakes are linked to large faults and there are no knots associated with them; 3) the SC was perceived in: 3.a) Veracruz, Mexico (I= 3 MSK, distance ~750 km); 3.b) Cienfuegos (I= 3 MSK, distance= 300 km); 3.c) Key West (I= 4 MSK, distance ~240 km); 3.d) La Habana (I= 5 MSK, distance= 85 km); 4) the following sugar factories were in the isoseismal area (~20 km2) of I= 8 (MSK): Almagro, Dos Hermanos, Galope, San Gabriel, and San Juan Bautista. All had been built with strong, think walls but collapsed. The SC earthquake probably produced a large pulse and most of the important damage was located in a small area, such as the one mentioned previously (Figure 1B); and 5) Tables 1, 6 and 7 contain data from the main earthquakes of the Wsu with I= 5 (MSK), and I= 7 (MSK). The period of occurrence between them is 25-43 years, with a mean of 34 years. Statistically we can say that an earthquake of Ms< 5 can hit this Unit every ~30 years. Nevertheless, a strong earthquake (Ms= 6.2) like the SC or the G has a longer period of occurrence, ~130 years.
Current thinking says that the direct interaction between plates produces high magnitude earthquakes which have short frequencies of occurrence. We took 3 strong earthquakes from the Ssu: 1766, 1852, and 1932 (Figures 7A, B; Table 9) since they have been studied more thoroughly and are well documented. The magnitudes are quite similar; the epicenters are situated in the southern part of the Santiago de Cuba city and very near each other (~15 km). The period of occurrence between them is 76 and 80 years, respectively and the last event was 83 years ago. Thus, statistically a new strong earthquake is quite probable in this southern region. With these elements it is possible to conclude that the most probable period for earthquakes in SC and G is every ~130 years. Also the area of occurrence of the strongest earthquake in the Ssu is smaller than the area in the Wsu. It is another element that can be used to study intraplate seismicity.
The first seismic station in Cuba was set up in Soroa around 1964 (coordinates: 22.740 N, 83.000 W, h= 204 m) (Figures 1B, 2 and 6A) (Cotilla, 2007). Cuban and Russian specialists decided it under the idea of SC earthquake took place in San Cristóbal town. Soroa is located in the mountainous SR (east part of the GMR), over the PF, and near the towns of SC and Candelaria in the south. To date, no noticeable SA has been reported, at least none that is traceable to the PF. Moreover, there are 7 artificial water reservoirs (separated ~1.5 km between them) located over the PF, as well as a group of industrial mining factories (quarries) where explosives are used systematically. The Soroa station only records the blasts in the quarries over the PF, but no earthquakes, and therefore PF activity can be ruled out. Figure 7 of Cotilla (2007) shows the earthquakes distribution (M <2.0) in the areas surrounding the GF.
The spatial distribution of the earthquake effects on GF is related to: 1) the earthquake magnitude and depth of occurrence; and 2) the tectonic characteristics of the region. Using these ideas we looked at the epicenters of SC and TJG (Tables 6, 8 and 10). They belong to the same Wnu and the distance that separates them is 220 km (Table 11). The SC earthquake affects a larger area than the TJG (Tables 6 and 10) and therefore, magnitude and depth played the most important role in this case.
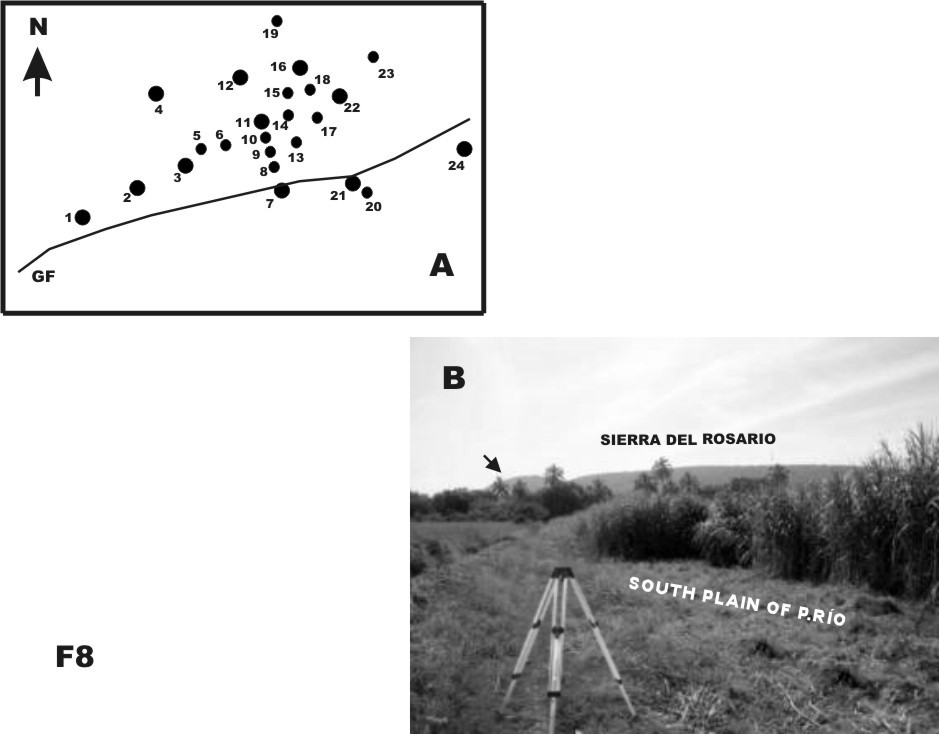
Figure 8.
San Cristóbal area
A) Scheme of the field trips around San Cristóbal.
Localities: 1= San Diego de los Baños, 2= El Pitirre, 3= La Tranquilidad, 4= Mameyal, 5= Rangel, 6= Esperanza, 7= San Cristóbal, 8= La Muralla, 9= Ojo de Agua, 10= Alto San Francisco, 11= Ciro Redondo, 12= Piedra de Genaro, 13= San Vicente, 14= La Soledad, 15= San Pablo, 16= Manantiales, 17= Esquina, 18= Las Minas, 19= San Diego de Nuñez, 20= Bayate (sugar factory Galope ruins), 21= Candelaria, 22= Soroa, 23= Casa Blanca, 24= Cayajabos.
B) Location of the sugar factory Galope ruins over the South Plain of Pinar del Río.
In front appears the Sierra del Rosario. Black arrow indicates the place where is located the Galope ruins.
The distance between the towns of SC and Candelaria is ~10 km (Figures 1B and 2). Both are in the South Plain of Pinar del Río [SPPR] where the 1880 earthquake produced the greatest amount of damage, including the destruction of the sugar factory Galope (Figures 8A, B). The study of the factory ruins (the quality of the construction, materials employed, orientation respect to the faults, etc.) was very important for understanding these processes.
Nikonov (1997) and Karakhanian et al. (2008) studied ancient ruins to explain earthquake occurrences where evidences of faults do not exist. Based on this, Cotilla and Córdoba (2011, 2010B) used the seismic data, the damage the SC earthquake caused to the walls of the ancient sugar factory (see their Figure 11), ground fractures, and the geomorphologic indicators in the relief of the SPPR to confirm the existence of the seismogenetic GF (Figures 1A and 3A). The structure is only minimally expressed in the relief. However, we find some indicators that the GF - PF system constitutes a flower structure. It is well documented that faults with different characteristics (figures and responses by the influences from the basement to the upper layer of sediments) can produce the flower structures. This is the case of the GF which is associated with the San Diego basin (S of the GMR) (Figure 6 of Cotilla and Córdoba, 2011)
Data of the Torriente - Jagüey Grande earthquake (16.12.1982)
Other data of the earthquakes in the Western region
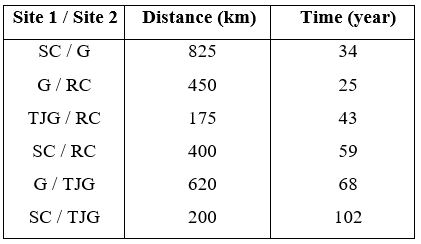
Note: G: Gibara; RC: Remedios - Caibarién; SC: San Cristóbal; TJG: Torriente - Jagüey Grande.
In their search for tectonic results in fluvial plains researchers mainly look for lineal fault ridges and sag ponds (Angelier et al., 2004; Campbell, 1978; Philip et al., 1992; Sylvester, 1988; and Wilcox and Seely, 1973). All these structures have lineal and stretch figures directly connected with transpressive conditions in the main deformation zone. They result from the different interaction in the fault planes with the lateral movement. These structures have a segmented and stepped geometry. We performed an in depth inspection of some of the places where González et al. (2003) placed 23 small positives active morphostructures (Figure 2). These are laterally displaced and all located south of an imaginary line between Consolación del Sur - Los Palacios - SC - Artemisa (Figures 1A and 2). They are not inside the SR.
In the field works we identified for the first time a set of linear fault ridges in the Wnu. They are small positive structures and located in the SPPR, over the GF (Figures 9A, B). The construction of the La Habana - Pinar del Río highway has altered the fault ridges that are on both sides of the road (Figures 10A, B). We determined a strike-slip movement and with these elements developed a kinematic model of compression and distension zones included in a Riedel faults model.
To the east and west of the epicenter area of the SC earthquake (I = 8, MSK) and over the SPPR we located a set of 5 small ponds where water accumulates (Figure 6B). They are ellipsoidal figures with the following dimensions (l1= ~20 m, l2= ~10 m, h= few centimeters), and SW-NE aligned in the SPPR. These structures are different from the larger and deeper water reservoirs that are farther to the SW in the area surrounding San Diego de los Baños (Figure 6A). We believe that these ponds are due to deformations of the relief caused by the influence of the GF. The end result is a set of interconnected linear fault ridges in the GF that indicate the existence of active cells where earthquakes occur (Figure 3A). They are thus classified as small pull-apart basins.
The existence of: 1) the set of fault ridges, sags, one strong earthquake epicenter (1880), 31 earthquakes from 1788 to 1981 (Table 12) and instrumental earthquakes on the trace of the GF, in the SPPR, between Candelaria and Consolación del Sur; and 2) the earthquake of PP (La Habana) in the eastern part of the GF, allow us to confirm its activity and strike-slip nature.
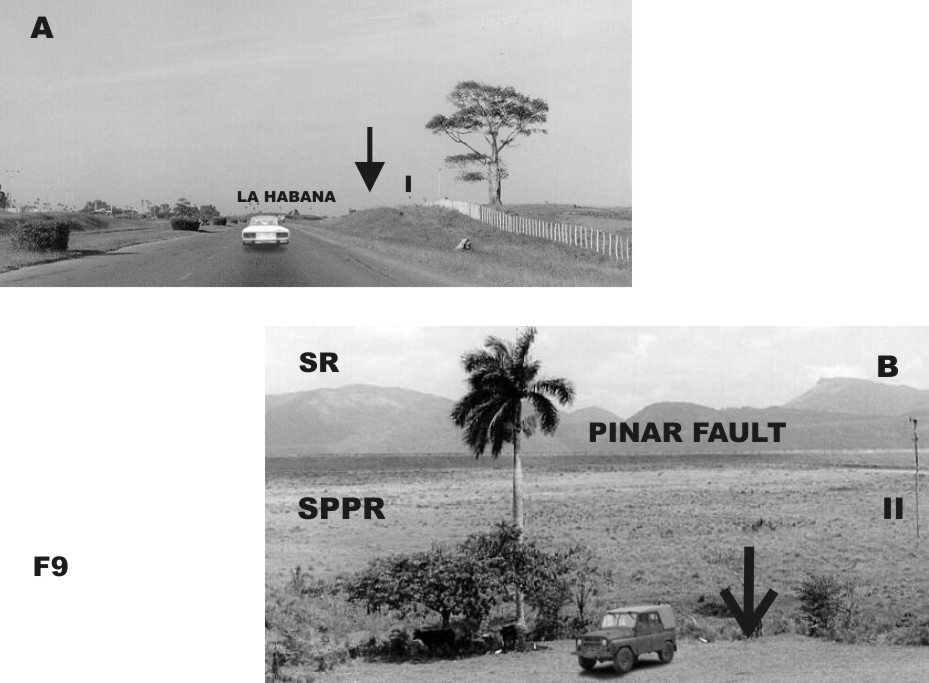
Figure 9.
Habana-Pinar del Río segment
A) A modified fault ridge in the highway Habana - Pinar.
Heavy black arrow and letter (I) indicate the fault ridge. It is over the South Plain of Pinar del Río.
B) The other rest of the fault ridge in the highway La Habana - Pinar.
Heavy black arrow and letter (II) indicate the fault ridge over the South Plain of Pinar del Río. Sites: SR= Sierra del Rosario, SPPR= South Plain of Pinar del Río.
Finally, we created a set of N-S transversal profiles of the GMR (which affect the PF and the GF) to establish the transmission of the stress tensor from the Caribbean - North American PBZ. The result is in line with data for recent crustal movements by Díaz and Lilienberg (1989) who indicated increasing values from north to south and from west to east. We find that: 1) there is a spatial coincidence with the epicenters determine by the Soroa seismic station over the SPPR; 2) the GF is located in this zone; 3) the direction of the energy released by the SC earthquake was toward the NE; 4) farther east of SC, but still over the GF, we determined its spatial relation with the HCF. In this knot an earthquake struck the village of PP (in 1995). It is clearly an active zone.
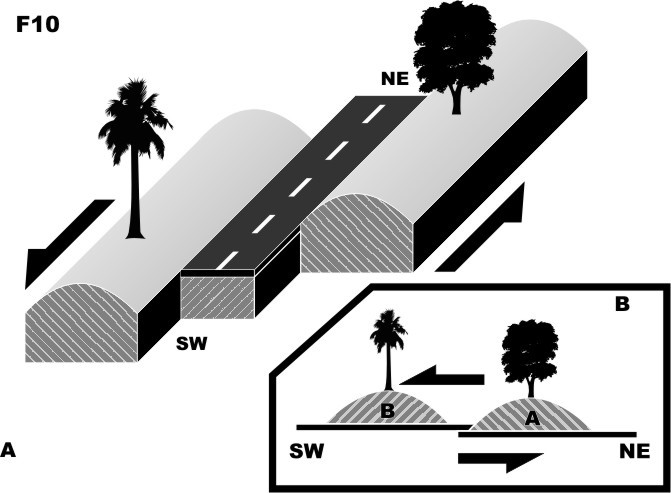
Figure 10.
. Neotectonic of Pinar del Río segment
A) Scheme of a fault ridge in South Plain of Pinar del Río.
B) Profile of the situations presented at figures 9A and 9B.
Seismicity reported on the Guane fault and surroundings
Conclusions
We thus conclude that: 1) the Guane fault is active (~100 earthquakes); 2) it has a maximum magnitude value of 6.2 with a period of occurrence of ~130 years; 3) the tectonic mechanism of intraplate readjustments through faults and block rotations are responsible for the earthquakes of 1880 (San Cristóbal, Pinar del Río), 1982 (Torriente-Jagüey Grande, Matanzas), and 1995 (Pedro Pí - San José de las Lajas, La Habana), in the Western Neotectonic Unit; and 4) the earthquakes of the Western Neotectonic Unit can be explained by the transpression process of the Caribbean and North American plates at the Swan and Oriente fault zones, and the consequent stress transmission toward the Cuban mega-block .
Acknowledgements
Acknowledgements
Funding by TSUJAL (CGL2011-29474-C02-01) and GR35/10-A/910549 projects are gratefully acknowledged. We also used vehicles of the Instituto de Geofísica y Astronomía (Cuba) to the field works (years: 1991, 1992, and 1993). It was very important the Joachim Pilarski’ economic and technical supports to the field researches in 1994, 1995 and 1996. The research was developed in the Departamento de Física de la Tierra, Astronomía y Astrofísica I, Facultad de Ciencias Físicas, Universidad Complutense de Madrid. We are grateful to Amador García Sarduy who drew the figures. The following specialists: Hans Joachim Franzke, Joachim Pilarski, Monika Pilarski, Vladimir Schenk, José Oro, Guillermo Millán, Otto Portuondo, Mario Campos and Francisco Arteaga participated in different field works.
References
Allen C.R. (1975). Geological criteria for evaluating seismicity. Geo.Mar.Lett., 86(8), 1041-1057.
Álvarez H. (1992). Mecanismos tectónicos y desarrollo estructural de la Sierra de los Órganos. Revista Minería y Geología, 1, 11-18.
Álvarez H. (1989). Secuencia estratigráfica olitrostómica y estructura de la depresión de San Diego; implicaciones en la tectónica de la Sierra de los Órganos. Resúmenes del I Congreso Cubano de Geología, La Habana, Cuba.
Álvarez H. (1981). Síntesis de la evolución geotectónica de la Sierra de los Órganos apoyada en el estudio de la geología del Valle de Pons. Informe del Centro Universitario de Pinar del Río, 272 p.
Álvarez L., Chuy T., García J., Moreno B., Álvarez H., Blanco M., Expósito O., González O. and Fernández A.I. (1999). An earthquake catalogue of Cuba and neighbouring areas. The Abdus Salam International Centre for Theoretical Physics, Miramare - Trieste. Internal Report IC/IR/99/1, 60 p.
Álvarez L., Serrano M., Rubio M., Chuy T., and González B. (1984). El terremoto del 19 de febrero de 1976. Pilón, región oriental de Cuba. Revista Investigaciones Sismológicas en Cuba, 5, 5-60.
Angelier J., Bergerat F., Bellou M. and Homberg C. (2004). Co-seismic strike-slip displacement determined from push-up structures: the Selsund fault case, South Iceland. Jour.Struc.Geol., 26, 709-724.
Balboa Navarro I. (2010). Libertos, vagos y bandoleros. La reglamentación del trabajo tras la abolición de la esclavitud, Cuba, 1886-1895. Relaciones, 127, 31 p.
Butticaz P. (1946A). Geological map Río Leña, scale 1:20000, Cuba. Archivo Nacional del Fondo Geológico.
Butticaz P. (1946B). Cuban geological report, N° 10 of Standard Oil Corporation. 30 p. Archivo Nacional del Fondo Geológico.
Campbell D.L. (1978). Investigation of the stress concentration mechanism for intraplate earthquakes. Geophys.Res.Lett., 5, 477-479.
Chuy T. (1989). Isosistas de terremotos de Cuba. Nuevo Atlas Nacional de Cuba. Sección Características Geofísicas, II.3.2. Madrid.
Cotilla M.O. (2014). Alternative interpretation for the active zones of Cuba. Geotectonics, 48(6), 459-483.
Cotilla M.O. (2007). Un recorrido por la Sismología de Cuba. Editorial Complutense, Madrid. ISBN 97-8-47- 491827-4.
Cotilla M.O. (2003). The Santiago de Cuba earthquake of 11 June 1766: Some new insights. Geofísica Internacional, 42(4), 589-602.
Cotilla M.O. (1999). El controvertido alineamiento Habana-Cienfuegos, Cuba. Estudios Geológicos, 55(1-2), 67-88.
Cotilla M.O. (1995). El sismo del 09.03.1995 en Ganuza, San José de las Lajas. Informe del Instituto de Geofísica y Astronomía, Ministerio de Ciencia, Tecnología y Medio Ambiente de Cuba, 10 p.
Cotilla M.O. and Álvarez J.L. (2001). Regularidades sismogenéticas de la unidad neotectónica Occidental de Cuba. Revista Geológica de Chile, 28(1), 3-24.
Cotilla M. and Córdoba D. (2011). Study of the earthquake of the January 23, 1880, in San Cristóbal, Cuba and the Guane fault. Izvestiya Physics of the Solid Earth, 47(6), 496-518
Cotilla M. and Córdoba D. (2010A). Study of the Cuban fractures. Geotectonics, 44(2), 176-202.
Cotilla M. and Córdoba D. (2010B). The Bayamo earthquake (Cuba) of the 18 October 1551. International Journal of Geosciences, 1, 1-13.
Cotilla M. and Córdoba D. (2008). Notes on three earthquakes in Santiago de Cuba (14.10.1800, 18.09.1826, 07.07.1842). Russian Geology and Geophysics, 51, 243-251.
Cotilla M.O. and Franzke H.J. (1999). Validación del mapa sismotectónico de Cuba. Boletín Geológico y Minero, 10(5), 21-28.
Cotilla M. and Udías A. (1999). Geodinámica del límite Caribe-Norteamérica. Rev.Soc.Geol. de España, 12(2), 175-186.
Cotilla M.O., Franzke H.J. and Córdoba D. (2007). Seismicity and seismoactive faults of Cuba. Russian Geology and Geophysics, 48, 505-522.
Cotilla M., Millán G., Álvarez L., González D., Pacheco M. and Arteaga F. (1993). Elementos del esquema neotectogénico de Cuba. Informe científico-técnico, Instituto de Geofísica y Astronomía. Ministerio de Ciencia, Tecnología y Medio Ambiente de Cuba, 100 p.
Cotilla M.O., Rubio M., Álvarez L. and Grünthal G. (1997). Potenciales sísmicos sector Centro-Occidental del arco de Las Antillas Mayores. Revista Geofísica, 46, 127-150.
Cotilla Rodríguez M., González Clemente E.C., Cañete Pérez C.C., Díaz Comesañas J.L., and Carral Chao R. (2003). La red fluvial de Cuba y su interpretación morfoestructural. Revista Geográfica, 134, 47-74.
Cotilla M., Cañete C., Díaz J.L. and Carral R. (1992). Evaluación de las mejores localidades para los emplazamientos nucleares de Cuba Centro-Oriental. Informe del Centro de Investigaciones Sismológicas, Academia de Ciencias de Cuba, 30 p.
Cotilla M., Bankwitz P., Franzke H.J., Álvarez L., González E., Díaz J.L., Grünthal G., Pilarski J. and Arteaga F. (1991A). Mapa sismotectónico de Cuba, escala 1:1000000. Comunicaciones Científicas sobre Geofísica y Astronomía, 23, 35 p
Cotilla M., González E.C., Franzke H.J., Díaz J.L., Arteaga F. and Álvarez L. (1991B). Mapa neotectónico de Cuba, escala 1:1000000. Comunicaciones Científicas sobre Geofísica y Astronomía, 22, 37 p.
Cotilla M., Franzke H.J., Pilarski J., Pilarski M., and Álvarez L. (1991C). Mapa de alineamientos y nudos tectónicos principales de Cuba, a escala 1:1000000. Revista Geofísica, 35, 53-112.
Cuevas T. (1900). La trocha de Mariel a Majana. Imprenta del Cuerpo de Artillería del Ejército Español. Madrid.
de las Cuevas Toraya J., Sala Santos G. and Padrón Valdés A. (2001). 500 años de construcciones en Cuba. Edited by D.V. Chavin. Servicios Gráficos y Editoriales, S.L., La Habana, 557 p.
Díaz Arenas A. (1989). Curvas de duración de caudales. Mapa de Cuba a escala 1:2000000. Nuevo Atlas de Cuba, Sección Recursos Hídricos, VII.1.2, Madrid.
Díaz J.L. and Lilienberg D.A. (1989). Nuevos datos sobre los movimientos recientes de Cuba Occidental. Reporte de Investigación del Instituto de Geografía, 4, 11 p.
Erickson A.J., Helsley C.E. and Simmons G. (1972). Heat flow and continuous seismic profiles in the Cayman trough and Yucatan basin. Geol.Soc. of Am.Bull., 83, 1241-1260.
Frohlich C. (1982). Seismicity of the Central Gulf of Mexico. Geology, 10, 103-106.
Fuchs Cw. C (1882). Die vulkanischen Ereignise des Jahres 1880. 16 Jahres bericht Mineral. Un. Petrographi. Mittelungen, Neue Folge, Band IV (pp. 51-96).
González Bacallao J.S. (2003). Tres siglos de compromiso evangelizador. In: Pinar del Río 300 años de compromiso evangelizador. Ediciones Vitral (Editor: J. Gaiga), Cap. XIV (pp. 107-140).
González B.E., Álvarez J., Serrano M., García J., Rodríguez V., Pérez L. and Fernández E. (1995). Informe científico-técnico del 9 de marzo de 1995: Ganuza, Municipio San José de las Lajas. Archivo del Centro Nacional de Investigaciones Sismológicas, Filial Occidental. Ministerio de Ciencia, Tecnología y Medio Ambiente de Cuba, 13 p.
González E.C., Cotilla M.O., Cañete C.C., Díaz J.L., Carral R. and Arteaga F. (2003). Estudio morfoestructural de Cuba. Geogr.Fis.Dinam.Quat., 26, 49-69.
Guelfand I.M., Guberman S.A., Keylis-Borok V.I., Knopoff L., Press F.S., Rantsman E.Y., Rotvain I.M. and Skii A.M. (1976). Condiciones de surgimiento de terremotos fuertes (California y otras regiones). Vichislitielnaya Seismologiya, 9, 3-91.
Hatter K.M., Michael N. and Richard L.D. (1993). Guidelines for US database and map for the maps of major active faults, western hemisphere. International Lithosphere Program (ILP), Proj. II-2. US Depart. of Interior, US Geological Survey, 45 p.
Heubeck Ch. and Mann P. (1990). Geologic evaluation of plate kinematic model for the Northamerican-Caribbean plate boundary zone. Tectonophysics, 191, 1-26.
Johnston A.E. and Kanter L.R. (1990). Earthquakes in stable continental crust. Sci.Am., 262(3), 68-75.
Karakhanian A.S., Trifonov V.G., Ivanova T.P., et al. (2008). Seismic deformation in the St. Simeon Monasteries (Qal’ at Sim’an), northwestern Syria. Tectonophysics, 453, 122-147.
Lay T. and Wallace T.C. (1995). Modern global seismology. International Geophysics Series, 58. Academic Press, San Diego, California.
Liu L. and Zoback M.D. (1977). Lithospheric strenghts and intraplate seismicity in the New Madrid seismic zone. Tectonics, 16, 585-595.
LeRoy S.D. (1998). Treating the Gulf of Mexico as a continental margin petroleum province. The Leading Edge, 1, 209-212.
Machette M., Personius S., Nelson A., Schwartz D. and Lund D. (1991). The Wasatch fault zone, Utah: segmentation and history of the Holocene earthquakes. J.Struct.Geol., 13(2), 137-149.
Mackey K.G., Fiyita K., Gunbina L.V., et al. (1997). Seismicity of the Bering Strait region: Evidence for Bering block. Geology, 25, 979-982.
Makarov G.V., and Schukin Yu.K. (1976). Valoración de las fallas ocultas. Geotectonika, 1, 96-109.
Makarov V.I., Dorozhko A.L., Makarova N.V. and Makeev V.M. (2007). Contemporary geodynamically active zones of platforms. Geoekologiya, 2, 99-110
Martínez Rodríguez J.B. (2003). Regulación del escurrimiento con régimen hidrológico alterado. Ingeniería Hidraúlica y Ambiental, 24(2), 1-8.
Nikonov A.A. (1997). Collapse of Antique Diosconia and Sebas Topolis as a result of seismic impacts. Geoekologiya, 4, 104-115.
NUREG-1451 (1992). Staff technical position on investigations to identify fault displacements and seismic hazards at a geologic repository. McCornell, K.I., Blackford, M.E. and Ibrahim, A.K. US Nuclear Regulatory Commission Washington, D.C. 20555.
Oficina Nacional de Estadísticas de la República de Cuba (2010). AE- Anuario estadístico. Separata de Pinar del Río.
Orbera L., González B., Chuy T. and Oro J. (1990). Investigaciones sísmicas en la región de emplazamiento del Centro de Investigaciones Nucleares. Vol. I, Secretaría Ejecutiva de Asuntos Nucleares, Cuba, 344 p.
Philip H., Rogozhin E., Cisternas A., Bousquet J.C., Borisov B. and Karakhanian A. (1992). The Armenian earthquake of 1988, December 7: Faulting and folding, neotectonics and paleoseismicity. Geoph.Jour.Int., 110, 141-158.
Pichardo E. (1872). Carta geográfica de la Isla de Cuba. Madrid.
Pichardo E. (1855). Carta geográfica de la Isla de Cuba. Madrid.
Reiter L. (1990). Earthquake hazard analysis. Colombia University Press, New York, 254 p.
Rockwood C.G. (1880). Notices of recent American earthquakes. American Journal of Sciences, 19(9), 25-299.
Rosencratz E. (1990). Structure and tectonic of the Yucatan basin, Caribbean Sea, as determine from seismic reflection studies. Tectonics, 9(5), 1037-1059.
Rosencratz E. and Mann P. (1991). Mapping of transform faults in the Cayman trough, Caribbean Sea. Geology, 19, 690-693.
Rosencratz E., Ross M.I. and Sclater J.G. (1988). Age and spreading history of the Cayman trough as determined from depth, heat flow and magnetic anomalies. J.Geophys.Res., 93, 2141-2157.
Sbar L. and Sykes L.R. (1973). Contemporary compressive stress and seismicity in Eastern North America: An example of intraplate tectonics. Geol.Soc.Am.Bull., 84, 1861-1882.
Secretaría de Economía de México (1956). Estadísticas Sociales del Porfiriato 1877-1910. Dirección General de Estadística. Edited by Talleres Gráficos de la Nación. México.
Smirnov V.B., Chadka R.K., Ponomarev A.V. and Srinagesh D. (2013). Prognostic anomalies of induced seismicity in the region of the Koyna-Warna water reservoirs, West India. Izvestiya, Physics of the Solid Earth, 49(2), 243 p.
Stein R.S. (1999). The role of stress transfer in earthquake occurrence. Nature, 402, 605-609.
Sykes L.R. (1978). Intraplate seismicity reactivation of prexisting zones of weakness, alkaline magmatism and tectonic postdating continental fragmentation. Reviews of Geophysics and Space Physics, 16(4), 621-688.
Sylvester A.G. (1988). Strike-slip faults. Geol.Soc.Am.Bull., 100, 1666-1703.
Taber S. (1922). The seismic belt in the Greater Antilles. Bull.Seism.Soc.Am., 12(4), 199-219.
Trifonov V.G. and Kozhurin A.I. (2010). Study of active faults: Theoretical and applied implications. Geotectonics, 44(6), 510-528.
Trifonov V.G. and Machette N.M. (1993). The world map of major active faults project. Annali di Geofísica, 36(3-4), 225-236.
USGS (2006). Earthquake Hazard Program. Earthquake Summary Poster. (http://earthquake.usgs.gov/eqcenter/eqarchives/poster/2006/20060910.php).
Van der Plujim B.A., Craddock J.P., Graham B.R. and Harris J.H. (1997). Paleostress in cratonic North-America: Implications for deformation of continental interiors. Science, 277, 794-796.
Viñes B. and P. Salteraín (1880). Excursión a Vuelta Abajo de Viñes y Salteraín en ocasión de los fuertes temblores de tierra ocurridos en la noche del 22 al 23 de enero de 1880. Ediciones La Voz de Cuba. La Habana, 68 p.
Wilcox R.E. and Seely D.R. (1973). Basic wrench tectonics. American Association of Petroleum Geologists Bull., 57(1), 74-96.
Wooters B. (1986). Seismicity and tectonics of southern Central America and adjacent regions with special attention in to the surrounding of Panama. Tectonophysics, 128, 21-46.
Zhidkov M.P., Rotvain I.M. and Sadowskii A.M. (1975). Pronóstico del lugar de posible ocurrencia de terremotos fuertes. Intersecciones múltiples de lineamientos de la Meseta Armeniana. Vichislitielnaya Seismologiya, 8, 53-70.
Zoback M.L. (1992). First- and second- order patterns of stress in the lithosphere: The World stress map project. J.Geophys.Res., 97, 11703-11728.
Notes