
Revista Geográfica
ISSN: 1011-484X
Número 59 Julio-diciembre 2017
Doi: dx.doi.org/10.15359/rgac.3-59.5
Páginas de la 125 a la 157 del documento impreso
Recibido: 18/1/2017 • Aceptado: 23/2/2017
|
Revista Geográfica ISSN: 1011-484X Número 59 Julio-diciembre 2017 Doi: dx.doi.org/10.15359/rgac.3-59.5 Páginas de la 125 a la 157 del documento impreso Recibido: 18/1/2017 • Aceptado: 23/2/2017 |
Identification of potential areas of land-use conflict in the Lujan river basin, Argentina
Identificación de áreas de potencial conflicto entre usos del suelo en la cuenca del río Luján, Argentina
Gustavo D. Buzai1
Noelia Principi2
National University of Luján, Argentina
ABSTRACT
Geography, as spatial science, relies on the use of quantitative methods applied with Geographical Information Systems (GIS). In this context, cartographic modeling and multicriteria evaluation techniques allowed the definition of a methodological strategy for identifying areas of potential conflict between land-use at a regional scale (LUCIS). The research is carried out in the Luján River basin with the objective of defining these areas as a consequence of future spatial competition between urban land use, agricultural production and conservation areas. The results obtained are an excellent tool to use in the field of land-use planning.
Keywords: Applied Geography, Regional Analysis, GIS, Multicriteria Evaluation, LUCIS
RESUMEN
La Geografía, como ciencia espacial, se apoya en la utilización de métodos cuantitativos aplicados con Sistemas de Información Geográfica (SIG). En este contexto, el modelado cartográfico y las técnicas de evaluación multicriterio permitieron definir una estrategia metodológica para la identificación de áreas de potencial conflicto entre usos del suelo en escala regional (LUCIS, Land-use conflict identification strategy). La investigación se realiza en la cuenca del río Luján con el objetivo de definir estas áreas como consecuencia de la futura competencia espacial entre el uso del suelo urbano, la producción agrícola y las áreas de conservación. Los resultados obtenidos constituyen una excelente herramienta de utilidad en la planificación territorial.
Palabras clave: Geografía Aplicada, Análisis Regional, SIG, Evaluación multicriterio, LUCIS
Introduction
The purpose of this report is to analyze theoretical-methodological aspects that allow identifying potential areas of conflict before the spatial evolution of land uses3, and it describes their application in the Luján River basin. Multicriteria evaluation techniques applied to Geographic Information Systems (GIS), as well as the resolution strategy called Land Use Conflict Identification Strategy (LUCIS) are detailed. The methodological path is conceptually based on systemic materialism (Bunge, 2012, 2014) and the analysis of the spatial level as focalization performed within the framework of complex systems theory. The construction of an organized totality is possible when modeling reality in thematic layers, in a process of differentiation and combination based on cartographic modeling in search of partial results and an integrating synthesis of the spatial situation.
The methodological procedures detailed throughout the report were first applied in Buzai and Baxendale (2007, 2008), where it has been demonstrated that they constitute an excellent alternative for the prospective study of geographical space. The identification of spatial structures allows defining potential areas of conflict as a result of the future spatial competition between urban expansion, agricultural production, and conservation areas.
Therefore, the result obtained constitutes a tool to support the spatial decision- making process in the sphere of planning for the generation of proposals and management for their potential implementation, in a constant search for actions that lead to a harmonious spatial evolution of land uses (Buzai and Baxendale, 2010, 2011; UF, 2014). The theory and methodology applied simplify their description and analysis in a central spatial focus in the context of Applied Geography with a systemic perspective.
Area of the Study
Luján River Basin
The area of the study is Luján River Basin, which is actually a sub-basin of the Great La Plata River Basin. It has an area of 3761 km2 (1452.13 sq mi) over which there are several municipalities of the northwestern sector of the Great Buenos Aires. It borders the basins of the Arroyo de la Cruz and the Areco River on the north; the Salado River basin on the west and the south, and the Reconquista River basin on the southeast.
The limits of the Luján River basin were set by Lanzelotti and Buzai (2015) by adjusting the limits defined in Buzai (2002) and Paso-Viola (2013) through the use of SRTM and ASTER GDEM satellite images corrected by means of visual interpretation.
The municipalities4 that integrate the basin are: Campana, Escobar, Exaltación de la Cruz, General Rodríguez, José C. Paz, Luján, Malvinas Argentinas, Mercedes, Moreno, Pilar, San Andrés de Giles, Carmen de Areco, Chacabuco, San Fernando, Suipacha and Tigre.
The general topography of the basin is regular, the maximum heights are located on the west, reaching approximately 60 mamsl, and they descend on the southeast until reaching sea level.
According to the National Water Institute (2007), the basin may be divided into three sections (Figure 1): the upper basin which extends from the sources up to the township of Luján, specifically in the town of Jáuregui, with a section median slope of about 0.45 m/km; the middle basin extends up to the township of Pilar, which coincides with the point where the river goes across National Route Nº 8, with a section median slope of 0.36 m/km, and finally, the lower basin extends up to the town of Tigre, where Luján River flows in the Paraná Delta, little after the crossing of National Route Nº 9, whose median slope is of 0.04 m/km.
The basin’s main river is the Luján River, which flows by the Pampa’s undulating plain. It originates in the confluence of Los Leones and Durazno creeks and the Castilla valley in the town of Carmen de Areco, and a small area of the town of Chacabuco, running from the southwest to the northeast along 115 kilometers (71.46 mi) up to its mouth in the Paraná Delta, and later, turns southeast and runs 42 km (26.1 mi) until reaching the La Plata River.
The Luján River is a lowland river with gentle slope. According to Paso-Viola (2016), its levels fluctuate between 46 and 58 m with an average in the upper section of about 47 m. Throughout its trajectory, landscapes are predominantly urban (Figures 2 and 3), rural (Figure 4), and semi-natural (Figure 5) as well as land uses that constitute the basis for the identification of potential spatial conflicts.
Figure 1. Study area

Figure 2. Luján River Dense urban landscape. City of Luján
Coordinates: 34° 52´ 56´´ S – 59° 06´ 57´´ O

Photo by GESIG / Gustavo D. Buzai
Figure 3. Luján River Sparse urban landscape. San Sebastián gated community (Municipality of Pilar)
Coordinates: 34° 20´ 43´´ S – 58° 54´ 38´´ O
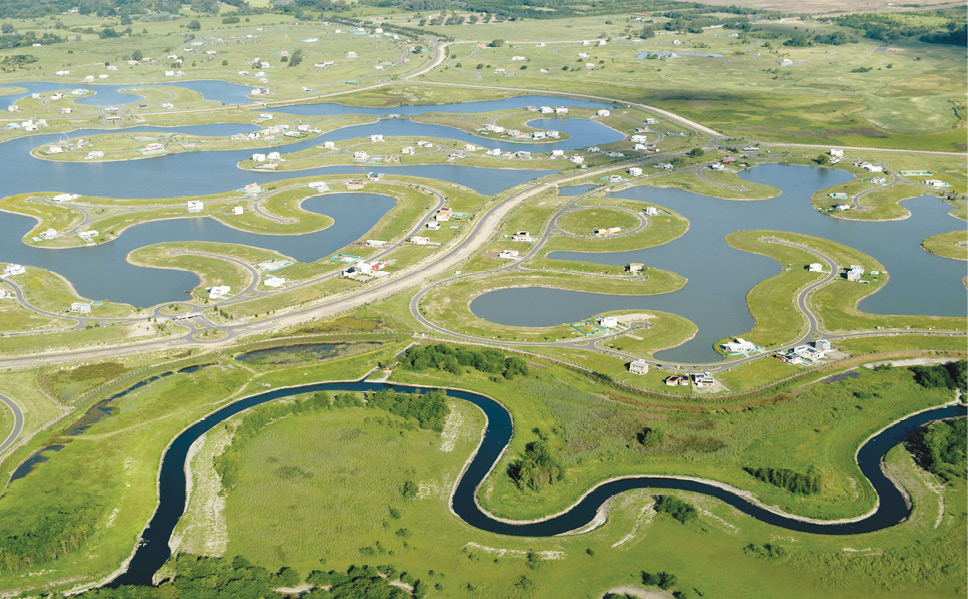
Photo by GESIG / Noelia Principi
Figure 4. Luján River Rural Landscape. Agriculture, semi-natural and urban areas (Municipality of Luján)
Coordinates: 34° 31´ 89´´ S – 59° 05´ 20´´ O

Photo by GESIG / Gustavo D. Buzai
Figure 5. Luján River Conservation landscape. Meander, riverside forest and alluvial plain (Municipality of Pilar)
Coordinates: 34° 22´ 53´´ S – 58° 55´ 06´´ O
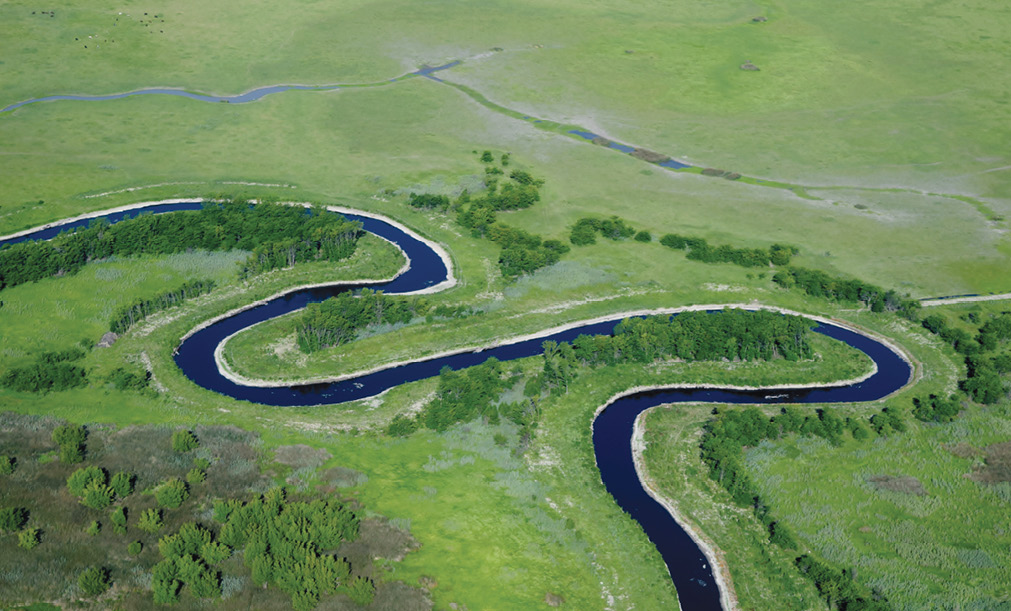
Photo by GESIG / Noelia Principi
Systems and systemic materialism
Spatial distribution does not occur randomly; instead, it is the result of general actions that lead to formulating scientific laws that explain land organization. From a systemic perspective, Geography is understood as the science that studies the laws governing the rules of spatial distribution. These will be the basis of the results obtained within a framework of Applied Geography (Pacione, 1999; Phlipponneau, 2001) in support of the intervention in land uses.
Considering these laws allows making theoretical projections about spatial distribution as a clear example of what a prospective Applied Geography would be, tending to discover causality relations and being able of modeling present and future spatial configurations.
Scientific studies, in general, tend to study not only specific objects; they are particularly interested in their relations. Therefore, the scientific perspective addresses totalities by considering reality as a system.
One of the approaches is provided by the General Systems Theory (GST) proposed by Bertalanffy (1968) as a global intellectual construction that progresses empirically in the study of elements and relations with the main goal of finding structural similarities between different systems. This makes evident mathematical aspects that can be used to study and describe trends at different scales (Buzai y Cacace, 2016), from a cell up to a galaxy, finding the human scale at an intermediate level.
In a system, it is impossible to explain isolated elements. Instead, they acquire their full dimension when relating different elements in the framework of the global structure that links them with each other. The GST allows joining separate pieces, which leads to scientific specialization and provides global analysis possibilities that later result in the advance in the search for specificities.
Approaching specific aspects will lead to focus attention on different scales in the search for complementarities. This possibility was provided by the Complex Systems Theory (CST) proposed by García (2006) based on the studies performed by Jean Piaget in Genetic Epistemology.
The CST demonstrated important capacities at two main levels: the study of land organization and the construction of knowledge based on its epistemological suitability (Piaget and García, 1983; García, 1997).
These capacities are possible because it conceives reality as a stratified organization based on scales with semiautonomous organizations. Applying CST concepts to the study of land organization, one can perform approaches that might end up in three main levels: one focal level, which would be the level of resolution of the issue at a spatial level, a supra-focal level of greater generality and an infra-focal level with greater level of detail. Therefore, there is an important conceptual stability given that there may be specific theories for each level of reality.
The GST focuses on general aspects and the CST includes specific aspects. Both give the chance to study reality as a totality in its multiple dimensions and details. The level of spatial analysis is the level of Applied Geography, the main focus is the search of spatial solutions to social problems and for that, our perspective is that of the systemic materialism presented by Bunge (2012, 2014).
From this perspective, Applied Geography is currently based on quantitative spatial analysis using GIS, and its focus is empirical at a regional level (Baxendale. 2007) with a wide range of application possibilities (Principi, 2013; Principi and Buzai, 2016). To achieve it, it is based on the consideration (Bunge, 2012) that reality does exist (realism), that it can be studied based on its material elements (materialism), that these elements relate widely to the formation of systems (systemics), and that the most efficient way to access it is through science (scientism).
Applying these concepts to our research work, we can support these four aspects based on the consideration that the Luján River basin, delimited by the water divide, exists in spite of the observer, that its content can be studied based on the material elements that lead to the definition of uses, that these uses have systemic links that allow obtaining results through the study of their distribution and spatial associations and, finally, that science, through GIS and spatial analysis allows modeling a slice of reality as an organized totality and obtain results that are useful to act upon empirical reality.
Methodological Framework
Multicriteria Evaluation Analysis
The logic underlying GIS sequences modeling to find optimal locations in different scales is based on the study area breakdown at a vertical level, which is made up of different thematic layers containing the essential variables (topics in the form of maps) useful for resolution.
There is a variety of procedures that may be applied to this spatial data structure, mainly those included in what is called cartographic modeling, a specialty more suitable for raster structures (Tomlin, 1990; DeMers, 2002) and which defines the application rules to obtain results through cartographic overlapping procedures. The greatest advance in cartographic modeling is constituted by the so called multicriteria evaluation techniques described comprehensively in Gómez Delgado and Barredo Cano (2006) and in Buzai and Baxendale (2011).
The analysis of multicriteria evaluation starts with some basic information in cartographic format which serves as criterion to carry out the evaluation procedures. There are two types of criteria: those presenting continuous values of location suitability in each variable called factors, and the thematic layers that have the purpose of confining results to a delimitated sector of the study area, called restrictions.
It is important to note that the logics of diffused treatment can be used in the formation of factors, fuzzy standardization to define suitable locations without accurate borderlines (Burrough and McDonnell, 1998; Jiang and Eastman, 2000) and that, according to Wilson and Burrough (1999) might be considered as one of the new basis for quantitative spatial analysis.
Through the selection of variables, their treatments tending to the generation of factors and restrictions, and the determination of different forms of combination, we are taking steps towards the search of results. The relationships are designated rules of decision, and their application process, evaluation.
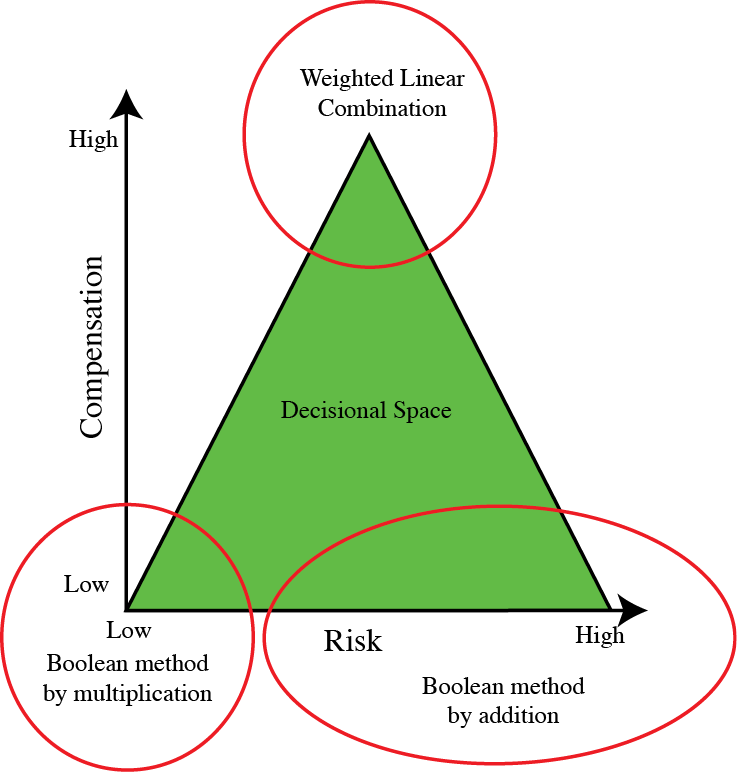
In Buzai and Baxendale (2011), these relationships are detailed together with the use of the strategic triangle (Figure 6) made up by a space of relationships in the interior of two orthogonal axes (axis x: level of risk, axis y: level of compensation) and possible solutions between Boolean methods by multiplication (analysis of minimum risk without compensation), by addition (moving towards the maximum risk without compensation), and weighted linear combination (analysis of medium risk with maximum compensation).
Figure 6. Strategic Decisions Triangle (locations)
Resolution Model
Taking the logic of multicriteria evaluation techniques as a basis supported by the use of GIS, Carr and Zwick (2006, 2007) have proposed a model of standardized resolution of interesting capacities for the empirical identification of potential areas of conflict between land uses.
The proposed model, which has been designated as LUCIS, includes the performance of several different steps as the resolution path towards obtaining the map with conflict areas. Some works that analyze this method are Buzai and Baxendale (2010, 2011) and UF (2014). Previous studies in the area of study can be found in Buzai, Baxendale, Cacace and Dzendoletas (2011), and the current application was performed by Principi (2016) in the framework of a scientific research project recognized nationwide.5 A present advance was made from an automation point of view based on the update of Zwick, Patten and Arafat (2016), which presents a new GIS application.
The steps for the application of the model are as follows:
1. Definition of objectives: The model considers that each location can have three general land-use categories: urban, agricultural or conservation activities. Each of these activities aims to maximize the opportunities in certain development lines; for example, the urban use seeks maximization of residential expansion and secondary and tertiary production activities; the agricultural use, expansion of primary production, mainly agriculture, and the conservation use for ecological protection.
2. Creation of a spatial database: It is created by generating a series of thematic layers through digitalization, which contain relevant and basic information for the achievement of each of the objectives previously mentioned. Besides the themes to be considered in the analysis, technical aspects of the creation of alphanumeric and graphic databases in the framework of GIS technology must also be defined at this point such as the extension of the study area, the projection system, and the minimum unit of spatial resolution.
3. Suitability analysis: Each thematic layer of the area of study is analyzed to determine a relative suitability of each criterion’s categories for each goal. It corresponds to the creation of factors for the application of multicriteria evaluation techniques. The LUCIS method considers the standardization of a continuous suitability (ac) in whole numbers complying with the following range:
[ 1 ] 1 ≤ ac ≤ 9
4. Determination of preferences: The weight of each factor in the resolution of the specific objective is set out. To obtain the result, it is necessary either to recourse to theoretical knowledge or use a methodology to obtain representative numbers of each factor’s weight. For this study, the mean reciprocal ranking method (Malczewski, 1999) was applied. The procedure of assigning weights can be supported by the collaboration among experts in each of the themes involved (Jankowski and Nyerges, 2001) and, mathematically, it complies with the following characteristics:
[ 2 ] ∑ pi = 1
[ 3 ] 0 < pi ≤ 1
5. Decision rule application and results reclassification: The weighted linear combination procedure is performed obtaining a synthetic index value for each location based on the definition of factors and weighted values for each of them as follows:
[ 4 ] Ii = ∑ pi xi
or by including spatial restrictions through the use of Boolean layer multiplication
[ 5 ] Ii = ∑ pi xi ∏ rj
The result is three general suitability maps for urban, agriculture or conservation uses. A reclassification takes each continuous suitability (ac) value to three categories as follows:
[ 6 ] 1 ≤ ac ≤ 3
The result is three suitability maps for each objective reclassified in high (A), medium (M) and low (B) suitability.
6. Identification of potential areas of conflict: The combination of conflictive and non-conflictive uses is found in the combination of the three categories for each objective based on a 3D dispersion chart representing the 27 possible combinations of the three suitability maps, taking into account Objective 1, Objective 2, and Objective 3 (Figure 7) The spaces that generate conflict in use assigning are as follows: LLL, MLM, HLH, MML, LMM, MMM, HMH, HHL, HHM, LHH, MHH and HHH which are marked with a darker color.
Figure 7. Combination of objectives and determination of potential conflict situations between land uses

Source: Own production.
Results
Towards Obtaining Suitability Maps
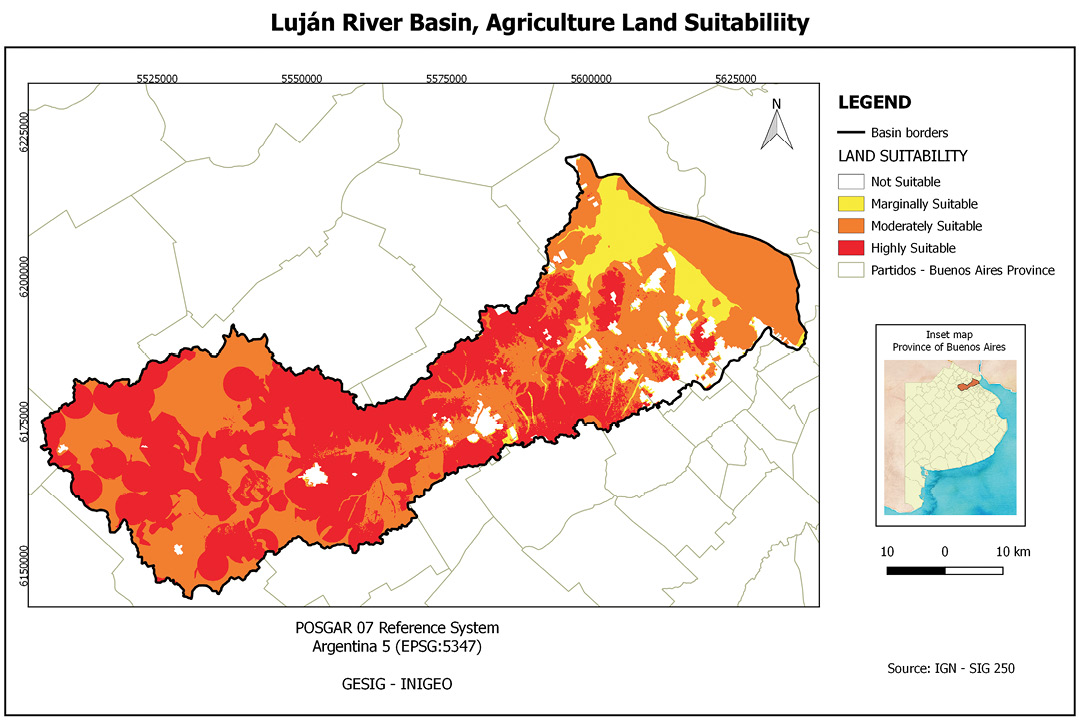
Urban Suitability
Each location’s suitability for urban development has been calculated based on 5 thematic layers in which the following factor creation procedures were applied:
(a) Urban areas. Considering existing urban areas and distance calculations, applying fuzzy decreasing linear calculations (255-0 in distances from 0 to 2000 meters).
Criterion: Proximity to urban areas
(b) Roads. Considering roads (includes national and provincial routes, paved and dirt roads) and distance calculations, applying fuzzy decreasing linear calculations (255-0 in distances from 0 to 3000 meters)
Criterion: Proximity to roads
(c) Train stations. Considering train stations and distance calculations, applying fuzzy decreasing linear calculations (255-0 in distances from 0 to 2000 meters).
Criterion: Proximity to train stations
(d) Wetlands: Low and wet lands, swampy sections and stretches sometimes flooded by rainwater or by a nearby river or lake. Considering wetlands as 0, applying fuzzy decreasing linear calculations (255-0 in distances from 0 to 10,000 meters from wetlands)
Criterion: Presence of wetlands
(e) Watercourses. Considering watercourses, first calculating a 1000-meter buffer and then, applying fuzzy decreasing linear calculations (255-0 in distances from 0 to 2000 meters considering the buffer).
Criterion: Proximity to watercourses
The weighting method took into consideration the following order with respect to the weight of factors: urban areas (1), roads (2), watercourses (3), wetlands (3) and train stations (4), yielding the following values as result: 0.41; 0.21; 0.14; 0.14 and 0.10, respectively. As for restrictions, the current urban areas map was used.
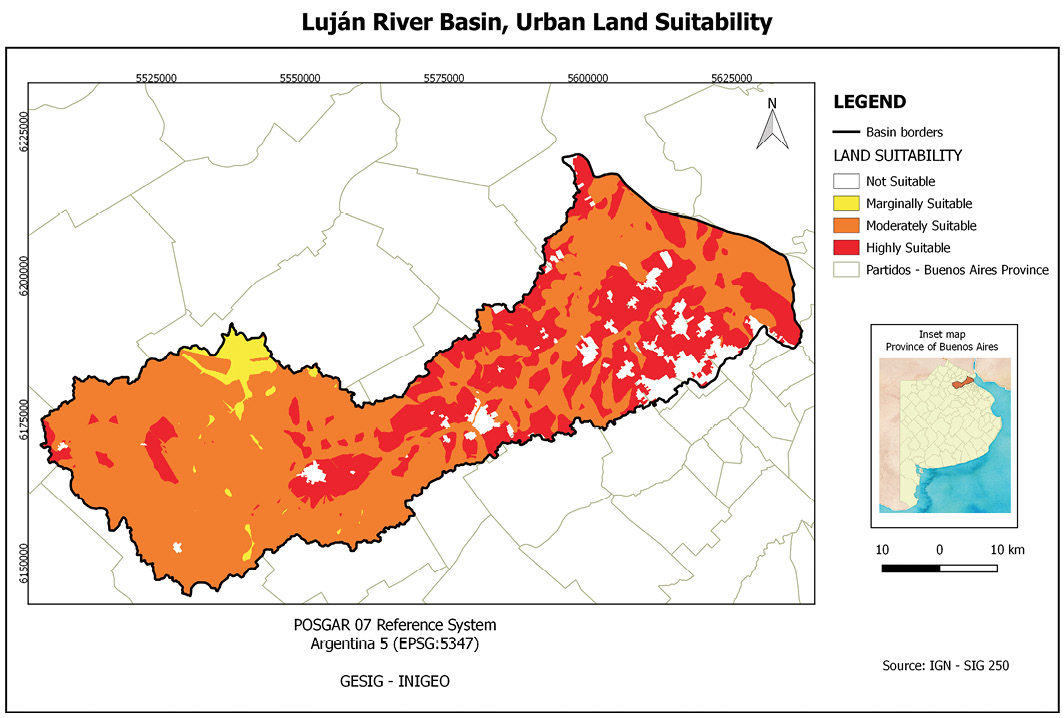
The urban suitability map shows a reclassification of the result into three categories, which will serve as a basis for later combination, corresponding to objective 1, which occupies axis x in Figure 7.
Figure 8. Urban Suitability Map
Agricultural Suitability
Each location’s suitability for the expansion of agricultural activities has been calculated based on 3 thematic layers in which the following factor creation procedures were applied:
(a) Topography (Categories: 0-10m, 10-20m, 20-30m, 30-40m, 40-50m and 50-60m). Application of fuzzy descending linear calculation (255-0 greater suitability coverage in the greater height category)
Criterion: Land height
(b) Soils (Categories: mixed land use, perennial plantations; artificial forest; small valley; wetlands; swamp, quaking bog, quagmire; abandoned channel; curb or small shells accumulation and urban plants). Reclassification in the following order: 1, 2, 3, 4, 5, 6, 7, 8 and 9, respectively. Application of fuzzy descending linear calculation (255-0 greater suitability coverage in the first category)
Criterion: Soil coverage
(c) Rural infrastructure. Considering existing rural infrastructure and calculating distances, applying fuzzy decreasing linear calculations (255-0 in distances from 0 to 4000 meters)
Criterion: Proximity to existing rural infrastructure
The application of the weighting method considered the following order with respect to the weight of thematic layers: Topography (1), Soils (1), rural infrastructure (3), yielding the following values as result: 0.43; 0.43 and 0.14, respectively.
The urban suitability map shows a reclassification of the result into three categories, which will serve as a basis for later combination, corresponding to objective 2, which occupies axis y in Figure 7.
Figure 9. Agricultural Suitability Map
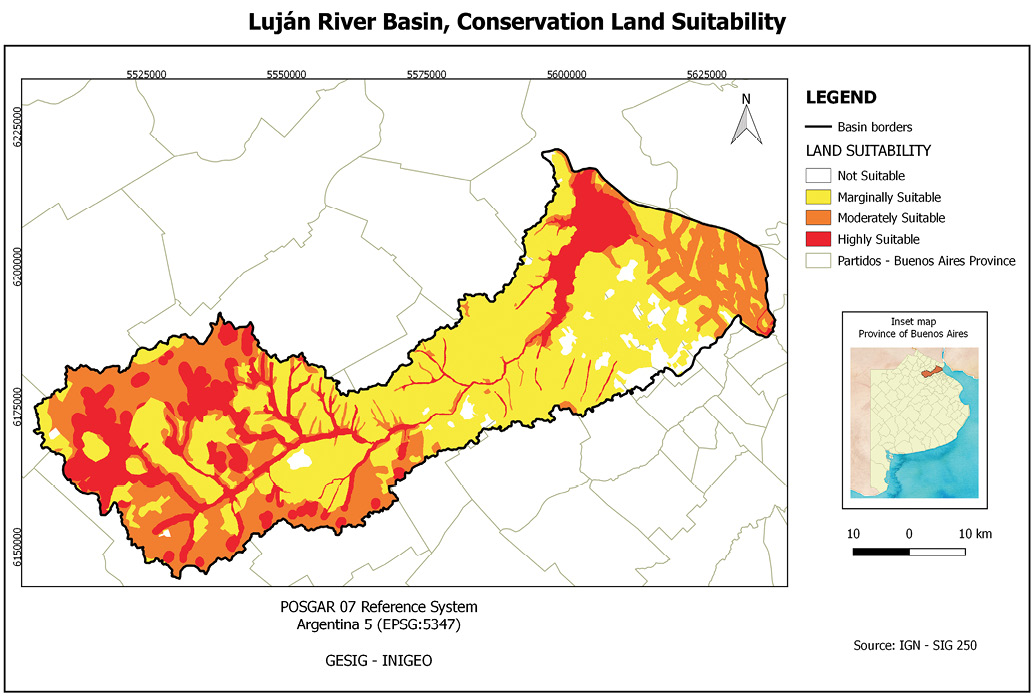
Conservation Suitability
The suitability of each location for conservation has been calculated based on the use of 3 thematic layers from which 3 factors were derived by applying the following factor creation procedures:
(a) Soils. (Categories: wetlands; small valley; abandoned channel; swamp, quaking bog, quagmire; curb or small shells accumulation; artificial forest; perennial plantations, mixed land use and urban plants). Reclassification in the following order: 1, 2, 3, 4, 5, 6, 7, 8 and 9, respectively. Application of fuzzy decreasing linear calculations (255-0 the most suitable coverage, the first category).
Criterion: Soil coverage
(b) Watercourses. Considering watercourses and distance calculations, applying fuzzy decreasing linear calculations (255-0 in distances from 0 to 1000 meters)
Criterion: Proximity to watercourses
(c) Bodies of water. Considering bodies of water and distance calculations, applying fuzzy decreasing linear calculations (255-0 in distances from 0 to 1000 meters)
Criterion: Proximity to bodies of water
The application of the weighting method considered the following order with respect to the weight of thematic layers: Soils (1), Watercourses (2), Bodies of water (2), yielding the following values as result: 0.50; 0.25 and 0.25, respectively.
The urban suitability map shows a reclassification of the result into three categories, which will serve as a basis for later combination, corresponding to objective 3, which occupies axis z in Figure 7.
Figure 10. Conservation Suitability Map
Towards obtaining the map of potential land-use conflicts
The synthesis of the methodological work is captured in the solution diagram (Figure 11), which details the sequence that led to the final result of the potential land-use conflict map.
Figure 11. Solution Concept Diagram

Fuente: Elaboración propia.
The identification of areas is done through the combination of categories of the above maps as partial objectives (urban, agricultural and conservation).
The urban suitability map was reclassified in hundreds (values from 1 to 100, from 2 to 200, and from 3 to 300), the agricultural suitability map was reclassified in tens (the values went from 1 to 10, from 2 to 3, and from 20 to 30), and the conservation suitability map kept its original values (1, 2 and 3).
By adding the three thematic layers (with three categories each: 1-low, 2-middle, and 3-high) a new thematic layer is produced, and it can even have a total of 27 combinations. The following are these combinations divided into those that produce areas of potential conflict (12 results) and those that do not (15 results).
The combinations of categories with potential conflict are: (111) Agricultural-urban-conservation* conflict, (122) Agricultural-conservation conflict, (133) Agricultural-conservation conflict, (212) Urban-conservation conflict, (221) Urban-agricultural conflict, (222) Urban-agricultural-conservation* conflict, (233) Agricultural-conservation conflict, (313) Urban-conservation conflict, (323) Urban-conservation conflict, (331) Urban-agricultural conflict, (332) Urban-agricultural conflict, and (333) Urban-agricultural-conservation * conflict 6
The combinations of categories with non-potential conflict are: (112) Conservation location, (113) Conservation location, (121) Agricultural location, (123) Conservation location, (131) Agricultural location, (132) Agricultural location, (211) Urban location, (213) Conservation location, (223) Conservation location, (231) Agricultural location, (232) Agricultural location, (311) Urban location, (312) Urban location, (321) Urban location, and (322) Urban Location
The results obtained for the Luján River basin are presented in Table 1 and its aggregation in generic categories in Table 2:
Table 1. Combinatorial disaggregated results of areas with potential conflict between land uses in the Luján River basin
|
Combination |
Predominant suitability classes |
Area (Km2) |
Area (%) |
|
111 |
Urban-Agricultural-Conservation |
No production |
- |
|
122 |
Agricultural-Conservation |
35.02 |
0.93 |
|
133 |
Agricultural-Conservation |
13.67 |
0.36 |
|
212 |
Urban-Conservation |
27.92 |
0.74 |
|
221 |
Urban-Agricultural |
188.43 |
5.01 |
|
222 |
Urban-Agricultural-Conservation |
562.05 |
14.95 |
|
233 |
Urban-Conservation |
203.57 |
5.41 |
|
313 |
Urban-Conservation |
13.33 |
0.35 |
|
323 |
Urban-Conservation |
8.37 |
0.22 |
|
331 |
Urban-Agricultural |
516.19 |
13.72 |
|
332 |
Urban-Agricultural |
7.41 |
0.20 |
|
333 |
Urban-Agricultural-Conservation |
1.98 |
0.05 |
|
Total |
Full Conflicts |
1577.94 |
41.95 |
Table 2. Combinatorial grouped results for areas with potential conflict between land uses in the Luján River basin
|
Combination |
Predominant suitability classes |
Area (Km2) |
Area (%) |
|
122-133-233 |
Agricultural-Conservation |
252.26 |
6.71 |
|
212-313-323 |
Urban-Conservation |
49.62 |
1.31 |
|
221-331-332 |
Urban-Agricultural |
712.03 |
18.93 |
|
222-333 |
Urban-Agricultural-Conservation |
564.03 |
14.99 |
|
Total |
Full Conflicts |
1577.94 |
41.95 |
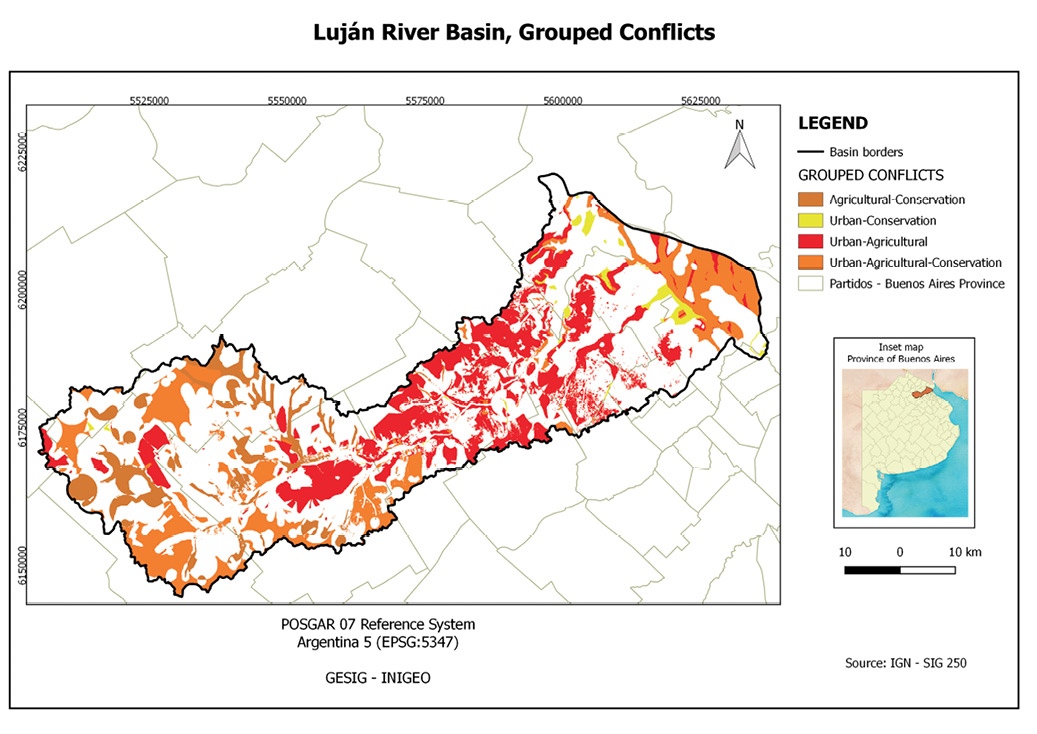
The synthesis map, obtained through the LUCIS method, shows the spatial distribution of potential conflicts described in Table 2.
Figure 12. Map of potential conflicts between grouped land uses
Conclusions
The synthesis of the methodological task performed on the basis of the modeling of sequences, adopted in the research, was presented sequentially at different points of this work. The stages correspond to the definition of criteria, the acquisition of suitability maps for each objective, and the final result, with spatial associations that are the basis of interpretation.
The tables presented provide area values of potential conflicts as a quantitative approach to their size.
The aggregate values show the synthesis obtained, and Figure 12 presents the spatial distributions as a base for obtaining it. The urban-agricultural combination turns out to be the largest area of potential conflict with an area of 712.03 km2 (274.92 sq mi) covering the whole basin and with predominance in the central sector. It is followed by the combination of the urban-agricultural-conservation suitability with 564.03 km2 (217.77 sq mi), mainly distributed in the ends corresponding to the lower basin (delta area) and to the upper one. The potential conflict between agricultural and conservation suitability, with 252.26 km2 (97.4 sq mi) is found mainly in the upper basin, and between urban-conservation classes with 49.62 km2 (19.16 sq mi) in the lower one.
The total area value of potential conflict is of 1577.94 km2 (609.25 sq mi) which corresponds to 41.95% of the Luján River basin that has a total area of 3761 km2 (1452.13 sq mi). Of this percentage, the urban-agricultural conflict concentrates 45.12%. The results obtained respond to a situation expected for a region with a great regional dynamics. There are fully urban and rural areas among a large peri-urban system, corresponding to the expansion of the Great Buenos Aires in structure of dispersed urbanization, and to the compact growth of medium-sized cities. Many of the more fertile soils of the country were localized as a support of an important agricultural production. Important bodies of water were also localized in a mosaic of landscapes suitable for the preservation of diversity.
Finally, we can say that the multicriteria evaluation techniques have become one of the most interesting lines of application of GIS technology as a tool for territorial planning, particularly in their ability to perform diagnoses and intervention proposals.
Based on them, the LUCIS method presents a series of procedures that link the quantitative and qualitative aspects, trying to identify areas of potential conflict in terms of the expansion of land uses. The product obtained for the Luján River basin has shown the theoretical-methodological suitability of the application procedures. The results offer a very useful spatial configuration for decision-making in regional planning, environmental regulation, or in the orientation of the urban growth. The possibilities of transferring these results to the higher levels in the political-administrative management7 constitute a later stage with a tendency to present the utility of what was obtained as a contribution of the Applied Geography oriented to the implementation of geographical knowledge aimed at the resolution of socio-spatial problems.
References
Baxendale, C.A. (2007). Región y estudios regionales. Consideraciones desde los diferentes enfoques de la Geografía [Region and Regional Studies. Considerations from Different Perspectives of Geography]. Fronteras. 6(6), 29-36.
Bertalanffy, L.von. (1968). General System theory: Foundations, Development, Applications. New York: George Braziller.
Bunge, M. (2012). A la caza de la realidad [Hunting the Reality]. Barcelona: Gedisa.
Bunge, M. (2014). Memorias. Entre dos mundos [Memories. Between Two Worlds]. Buenos Aires: EUDEBA.
Burrough, P.A., McDonnell, R.A. (1998). Principles of Geographical Information Systems. Oxford: Oxford University Press.
Buzai, G.D. (Dir.) (2002). Altas digital de la cuenca del río Luján [Digital Atlas of Luján River Basin]. Luján: Universidad Nacional de Luján. (CD version).
Buzai, G.D., Baxendale, C.A. (2007). Áreas de potencial conflicto entre usos del suelo. Identificación mediante el uso de Sistemas de Información Geográfica (Primera parte: descripción metodológica) [Areas of Potential Conflict between Land Uses. Identification through the Use of Geographic Information Systems (First Part: Methodological Description)]. Fronteras. 6(6), 45-49.
Buzai, G.D., Baxendale, C.A. (2008). Áreas de potencial conflicto entre usos del suelo. Identificación mediante el uso de Sistemas de Información Geográfica (Segunda parte: aplicación) [Areas of Potential Conflict between Land Uses. Identification through the Use of Geographic Information Systems (Second Part: Application)]. Fronteras. 7(7), 33-39.
Buzai, G.D., Baxendale, C.A. (2010). Método LUCIS [LUCIS Method] – Land Use Conflict Identification Strategy. Geografía y Sistemas de Información Geográfica [Geography and Geographic Information Systems]. (Bibliografía, Software y Metodología). 2(2),1-4.
Buzai, G.D., Baxendale, C.A. (2011). Análisis Socioespacial con Sistemas de Información Geográfica [Socio-Spatial Analysis with Geographic Information Systems]. Volume 1: Perspectiva científica – temáticas de base vectorial [Scientific Perspective—Vectorial Base Topics]. Buenos Aires: Lugar Editorial.
Buzai, G.D., Baxendale, C.A., Cacace, G., Dzendoletas, M.A. (2011). Análisis de usos del suelo urbano y regional. Localizaciones óptimas y conflictivas estudiadas con Sistemas de Información Geográfica [Analysis of uses of Urban and Regional Soils. Best and Conflictive Localizations studied with Geographic Information Systems]. PROEG 11. Luján: Universidad Nacional de Luján.
Buzai, G.D., Cacace, G. (2016). El concepto de espacio [The concept of Space]. In: Buzai, G.D., Baxendale, C.A.; Humacata, L., Cacace, G., Delfino, H., Lanzelotti, S., Principi, N. Geografía y Análisis Espacial. Aplicaciones urbano-regionales con Sistemas de Información Geográfica [Geography and Spatial Analysis. Urban-Regional Applications with Geographic Information Systems]. (51-56). Luján: EdUNLu.
Carr, M.H.; Zwick, P.D. (2006). Using GIS suitability analysis to identify potential future land use conflicts in north central Florida. Journal of Conservation Planning. 1(1), 89-105.
Carr, M.H.; Zwick, P.D. (2007). Smart Land-Use Analysis. The LUCIS Model. ESRI Press. Redlands.
DeMers, M. (2002). GIS Modeling in Raster. New York: John Wiley.
García, R. (Coord) (1997) La Epistemología Genética y la ciencia contemporánea [Genetic Epistemology and the contemporary Science]. Barcelona: Gedisa.
García, R. 2006. Sistemas Complejos [Complex Systems]. Barcelona: Gedisa.
Gómez Delgado, M., Barredo Cano, I. (2006). Sistemas de Información Geográfica y evaluación multicriterio en la ordenación del territorio [Geographic Information Systems and Multicriteria Evaluation in the Spatial Planning]. México DF: Alfaomega-Ra-Ma..
Instituto Nacional del Agua [National Institute of Water]. (2007). Diagnóstico del funcionamiento hidrológico hidráulico de la cuenca del río Luján – provincia de Buenos Aires [Diagnosis of the Hydrological Functioning of Luján River Basin—Buenos Aires Province]. Ministerio del Interior, Obras Públicas y Vivienda [Ministry of the Interior, Public Works and Housing]. Ezeiza.
Jankowski, P.; Nyerges, T. (2001). GIS-Supported Collaborative Decision Making: Results of an Experiment. Annals of the Association of American Geographers. 91(1),48-70.
Jiang, H., Eastman, J.R. (2000). Application of fuzzy measures in multi-criteria evaluation in GIS. International Journal of Geographical Information Sciences. 14(2), 173-184.
Lanzelotti, S.L.; Buzai, G.D. (2015). Delimitación de la cuenca del río Luján, Provincia de Buenos Aires Argentina [Delimitation of Luján River basin, Buenos Aires Province, Argentina]. Informe Técnico N° 1 [Technical Report N° 1]. PICT-2014_1388. GESIG-PRODISIG. Luján: Universidad Nacional de Luján.
Malczewski, J. (1999). GIS and multicriteria decision analysis. New York: John Wiley & Sons.
Pacione, M. (1999). Applied Geography: Principles and Practice. London: Routledge.
Paso-Viola, L.F. (2015) Análisis cronológico documental de la evolución de la cartografía en la alta cuenca del río Luján bajo la óptica de los procesos histórico globales y locales. Diagnóstico cartográfico geonímico, toponímico y geoespacial del Partido de Suipacha como modelo casuístico [Chronological Documentary Analysis of Cartography Evolution in the Luján River High Basin Under the Perspective of Global and Local Historic Processes. Cartographic, Geonimic, Toponimic and Geo-Spatial Diagnose of Suipacha Partido as Casuistic Model]. (Tesis de Licenciatura en Geografía. Universidad Nacional de Luján [Bachelor’s degree thesis in Geography. National University of Luján]).
Paso-Viola, L.F. (2016). Origen del Río Luján en el área imbrífera localizada en los partidos de Chacabuco, Suipacha y Carmen de Areco y su representación cartográfica [Luján River Origins in the Drainage Basin of Chacabuco, Suipacha and Carmen de Areco and their Cartographic Representation]. Social Networks. 3(1),17-30.
Philipponneau, M. (2001). Geografía Aplicada [Applied Geography]. Barcelona: Ariel.
Principi, N. (2013). Análisis de la estructura espacial regional [Analysis of the Regional Spatial Structure]. Editorial Académica Española: Saarbrücken.
Principi, N. (2016). Evaluación multicriterio para la identificación de áreas con potenciales conflictos entre usos del suelo en la cuenca del río Luján [Multicriteria Evaluation for the Identification of Areas with Potential Conflicts between Land Uses in the Luján River Basin] (Buenos Aires, Argentina). (Trabajo final de graduación. Maestría Profesional en Sistemas de Información Geográfica y Teledetección [Master’s Paper. Master Degree in Geographic Information Systems and Remote Sensing]. UCR-UNA. San José, Costa Rica)
Principi, N., Buzai, G.D. (2016). Análisis especial para la determinación de la estructura socioespacial del Noroeste de la Provincia de Buenos Aires [Special Analysis for the Determination of the Socio-Spatial Structure of Nothwestern Region of Buenos Aires Province]. In: Buzai, G.D., Baxendale, C.A., Humacata, L., Cacace, G., Delfino, H., Lanzelotti, S., Principi, N. Geografía y Análisis Espacial. Aplicaciones urbano-regionales con Sistemas de Información Geográfica. [Geography and Spatial Analysis. Urban-Regional Applications with Geographic Information Systems] (197-204). Luján: EdUNLu.
Tomlin, C.D. (1990). Geographic Information Systems and Cartographic Modeling. New Jersey: Englewood Cliffs – Prentice Hall..
UF .(2014). Land Use Conflict Identification Strategy (LUCIS). Technical Report. LUCIS Technical Report. Heartland 2060. University of Florida..
Wilson, J.P. & Burrough, P.A. (1999). Dynamic Modeling, Geostatistics, and Fuzzy Classification: New Sneakers for a New Geography? Annals of the Association of American Geographers. 89,736-746.
Zwick, P.D.; Patten, I.E.; Arafat, A. (2016). Advanced Land-Use Analysis for Georegional Design. Using LUCISplus. Redlands: ESRI Press.
1 Professor with Bachelor’s Degree (Geography, University of Buenos Aires), Doctorate (Geography, National University of Cuyo) and Post-Graduate Internships (UAM Spain, UIBK Austria). National University of Luján and National Council of Scientific and Technical Research (CONICET, per its acronym in Spanish) Institute of Geographical Research (INIGEO, per its acronym in Spanish), Director of the Teaching and Research Program in Geographic Information Systems (PRODISIG, per its acronym in Spanish). Argentina. buzai@unlu.edu.ar
2 Professor with Bachelor’s Degree (Geography, National University of Luján) and Master (Geographic Information Systems and Remote Sensing, University of Costa Rica and the National University, Costa Rica). National University of Luján Institute of Geographical Research (INIGEO, per its acronym in Spanish), Coordinator of Spatial Analysis Laboratory and Geographic Information Systems (LabSIG). Argentina. nprincipi@unlu.edu.ar
3 The term land use is employed because it is institutionally recognized in the Republic of Argentina. The geographic area encompassed by the Luján River basin is regulated by Decree-Law 8912/77 TERRITORIAL ZONING AND LAND USE ACT (Text Ordered by Decree 3389/87, with the amendments of Decree-Law N° 10128 and Laws N° 10653, 10764, 13127, 13342, and 14449) of the Ministry of Government of Buenos Aires Province.
4 In the Republic of Argentina, political-administrative divisions are as follows ordered by size: 1st Level (Country), 2nd Level (Province), 3rd Level (Department or Partidos of the Province of Buenos Aires, where they spatially match the respective township). From here, there are census divisions: 4th Level (Census Fractions) and 5th Level (Census Radii).
5 Project: Spatial analysisand evaluation of areas of potential environmental, productive, and patrimonial conflicts in face of the urban expansion in the Luján River basin (Buenos Aires Province, Argentina). Director: Dr. Gustavo Buzai, Co-director: Dra. Sonia L. Lanzelotti. Scientific and Technological research Project (PICT-1388-2014) of the National Agency of Scientific and Technological Promotion (ANPCyT) of the Republic of Argentina.
6 The asterisk (*) indicates a major conflict in those locations where there is similar suitability in all three categories. Other conflictive combinations occur between two categories.
7 The National University of Luján has cooperation and transfer agreements with the Committee of the Luján River Basin (COMILU) and with the municipalities members of the Committee. It is also one of the academic units of the inter-institutional university network, UNIDESARROLLO, whose members are the universities of the Luján River and Reconquista basins. Toward these institutional spheres are directed the results of research projects that take the regional space as an area of study.

Esta obra está bajo una Licencia Creative Commons Atribución-NoComercial-SinDerivar 4.0 Internacional.