MHSalud, ISSN: 1659-097X, 17(2), Julio-Diciembre, 2020, pp. 1-14

MHSalud, ISSN: 1659-097X, 17(2), Julio-Diciembre, 2020, pp. 1-14
Assessments of Anthropometric, Physiological and Fitness Indicators According to Sex and Age in Participants of a Swimming Program
Evaluación de indicadores antropométricos, fisiológicos y de aptitud según el sexo y la edad de participantes de un programa de natación
Avaliação de indicadores antropométricos, fisiológicos e de fitness, de acordo com o sexo e a idade dos participantes de um programa de natação
Assessments of Anthropometric, Physiological and Fitness Indicators According to Sex and Age in Participants of a Swimming Program
MHSalud, vol. 17, núm. 2, 2020
Universidad Nacional
Recepción: 10 Abril 2019
Aprobación: 11 Febrero 2020
Abstract: This study aimed to assess anthropometric, physiological, and fitness variables related to health in 158 participants of a swimming program (89 men and 69 women), distributed in three age groups (18-29 years, 30-39 years, 40-48 years). The following protocols were used: 1) bioimpedance analysis to determine the body weight (BW), body mass index (BMI), and body fat percentage (BFP); 2) a measuring tape to measure waist circumference (WC); 3) an automatic sphygmomanometer to obtain systolic (SBP) and diastolic (DBP) blood pressure; 4) a Sit and Reach test was used to evaluate flexibility and the push-up test to evaluate muscular endurance. The results showed that BFP and (BMI) were the variables in which the highest number of people presented unhealthy values, according to international parameters. Significant differences (p<0.05) were found in SBP, DBP, WC, BFP, BMI, and muscle endurance according to sex and age. Significant correlations were found between physiological responses, physical fitness, and body composition. In conclusion, age and sex influence the results of the variables. Results were found that represent metabolic and cardiorespiratory risk factors.
Keywords: anthropometry, health, physical exercise, swimming.
Resumen: El propósito de este estudio fue evaluar variables antropométricas, fisiológicas y de aptitud física relacionadas con la salud en 158 participantes de un programa de natación (89 hombres y 69 mujeres) distribuidos en tres grupos de edad (18-29 años, 30-39 años y 40-48 años). Los protocolos utilizados fueron: análisis de bioimpedancia para determinar el peso corporal (PC), porcentaje de grasa corporal (PGC) e índice de masa corporal (IMC), una cinta métrica para medir la circunferencia de cintura (CC), un esfigmomanómetro automático para obtener la presión arterial diastólica (PAD) y diastólica (PAS), la prueba de Set and Reach y prueba de Push up para evaluar la flexibilidad y resistencia muscular respectivamente. Los resultados evidenciaron que el PGC y en el IMC fueron las inconstantes en las que mayor cantidad de personas presentaron valores no saludables, de acuerdo con parámetros internacionales. Se encontraron diferencias significativas (p<0.05) en la PAD y PAS, la CC, el PGC, el IMC y en la resistencia muscular según el sexo y la edad de las personas. Se hallaron correlaciones significativas entre las respuestas fisiológicas, la aptitud física con la composición corporal. En conclusión, la edad y el sexo influyen sobre los resultados de las variables analizadas. Se detectaron resultados que representan factores de riesgo metabólico y cardiorrespiratorio.
Palabras clave: antropometría, ejercicio físico, natación, salud.
Resumo: O objetivo deste estudo foi avaliar variáveis antropométricas, fisiológicas e de aptidão física relacionadas à saúde em 158 participantes de um programa de natação (89 homens e 69 mulheres) distribuídos em três faixas etárias (18-29 anos, 30-39 anos e 40-48 anos). Os protocolos utilizados foram: análise de bioimpedância para determinar o peso corporal (PBC), percentagem de gordura corporal (BFG) e índice de massa corporal (IMC), uma fita métrica para medir a circunferência da cintura (CC), um medidor de pressão automático para obter a pressão arterial diastólica (PAD) e a pressão arterial diastólica (PAS), o teste Set e Reach e o teste Push up para avaliar a flexibilidade e a força muscular, respectivamente. Os resultados mostraram que o PGC e o IMC foram os inconstantes em que o maior número de pessoas apresentou valores pouco saudáveis, de acordo com parâmetros internacionais. Foram encontradas diferenças significativas (p<0.05).
Palavras-chave: antropometria, exercício físico, natação, saúde.
Introduction
Anthropometric, physiological, and physical fitness assessments aim to give an approximation to the physical state of the human health, providing inputs to detect, at an early stage, risk factors for non-transmissible chronic diseases at a cardiovascular and metabolic level (Ahmad, Raham, Zaman, & Jan, 2011; Chuang et al., 2012; Espinoza-Navarro, Brito-Hernández, & Lagos-Olivos, 2020).
Among the most used anthropometric protocols are the body mass index (BMI), which establishes the relationship between body weight and height, a tool used globally to identify overweight and obesity levels. The body fat percentage (BFP) and waist circumference (WC) are indicators of the amount and distribution of adipose tissue in the body (Liu, Ma, Lou & Liu, 2013; Michelotto, Martins, Machado, Santos, & Carvalho, 2010; Ranasinghe et al., 2013; Padilla, 2014).
The reported values of body mass index categorized as healthy ranged from 18 to 25 kg/m2 and, as unhealthy, exceeded 26 kg/m2. Healthy values of fat percentage reported were between 13% and 33%, and the unhealthy ones corresponded to values above 34%. For the waist circumference, the parameters reported as healthy corresponded to values below 80 cm for women and 102 cm for men (Corvos-Hidalgo & Corvos-Hidalgo 2013; Cossio-Bolaños et al. 2011, Fedewa, Nickerson, & Esco, 2019; Rivera-Cabezas & Ureña-Bonilla, 2014; Rodríguez-Montero, Ureña-Bonilla, Blanco-Romero, Sánchez-Ureña & Salas-Cabrera, 2014).
Physiological indicators are systolic (SBP) and diastolic (DBP) blood pressure, which are used to assess the cardiovascular condition of people (Beaney et al., 2018; Castillo, Chávez, Fernández, Alfonzo & Alfonzo, 2011). Authors like Campos-Nonato et al. (2013) and Restrepo, Agudelo, Conde & Pradilla (2012) evaluated SBP and DBP in young adults. Instead, Škrkar, Mikalack, Cokorilo & Eric (2015) assessed groups of women, generally reporting in the previous studies that unhealthy parameters corresponded to values higher than 130 mm/hg in SBP and higher than 90 mm/hg in DBP, these being related to symptoms of prehypertension and arterial hypertension (Beaney et al., 2018; Tejedo, 2010).
The physiological responses of the organism are related to the anthropometric indicators since overweight and unhealthy parameters in body fat percentage and waist circumference had high blood pressure values, considered as pre-hypertension or arterial hypertension because the body fat is lodged in the arteries creating peripheral resistance (Ahmad et al., 2011; Arteagal et al., 2010; Castillo et al., 2011; Christofaro et al., 2011; Santos, Petroski, & Peres, 2012;Urrea, 2018; Wang et al., 2020).
Similarly, a good physical condition, mainly at the muscular level, is also an indicator of people’s health (García-Soidán & Alonso-Fernandez, 2011). The most used physical qualities to assess the levels of physical fitness are flexibility, strength, and muscular endurance; this is because studies show that performance categorized as healthy, in physical fitness protocols, tends to be related to healthy parameters in variables of body composition and cardiovascular level (Dunsky et al., 2013; Esco, Olson, & Williford, 2008; Silva-Batista, Urso, Silva, & Bertuzzi, 2013; Vaara et al., 2012). In this matter, interventions performed to assess levels of hip and leg flexibility at the ischemic level stand out in the university student population (Benavent, Tella, González-Millan & Colado, 2008; Ramos, Alzate, Ayala, Franco & Sánchez, 2009) and in adult men and women (Delgado, Martín, Zurita, Antequera & Fernández, 2009; García & Aznar, 2011). Likewise, evaluations of the strength and muscular resistance, performed in populations of young adults, have reported lower values than those required to be considered healthy in both men and women according to international parameters in tests of push-ups and abdominal resistance (Zaragoza, Serrano, & Generelo, 2004).
Sex and age are variables to be taken into account for their influence on the physiological, anthropometric, and physical fitness variables. In relation to sex, it have been observed differences between men and women in the accumulation and distribution of body fat (Michelotto et al., 2010; Cossio-Bolaños et al., 2011; Piernas, Hernández, Canteras, Zamora & Garaulet, 2008; Rodríguez et al., 2014; Rojas-Valverde et al, 2016), as well as in the physical aptitudes (Benavent et al., 2008; Delgado et al., 2009; Vaquero, González, Ros & Alacid, 2012; García-Soidán & Alonso-Fernández, 2011; Zaragoza et al., 2004). In the case of age, the processes of aging affect the functionality of the organism. It has been reported that younger people more frequently show values considered as healthy in the anthropometric (Rivera-Cabezas & Ureña-Bonilla, 2014; Rodríguez-Montero et al., 2014) and physiological variables (Campos-Nonato et al., 2013; Škrkar et al., 2015). In contrast, in physical qualities, age causes a decrease in performance as it increases (Vaquero et al., 2012; Zaragoza et al., 2004).
Regarding the Central America area, only in Costa Rica, some descriptive studies were identified that have evaluated anthropometric variables in different populations. In this sense, evaluations for health and the physical aptitude have been made in the business world (Rodríguez-Montero et al., 2014), in adults attending physical fitness centers (Rivera-Cabezas & Ureña-Bonilla, 2014), and in a recreation center (Rojas-Valverde et al., 2016). More recently, Rivera, Ureña, Fernández, Quesada, & Gómez (2017) reported evaluations with populations from a university campus. Therefore, based on the evidence provided in the scientific literature, and on the fact that there is not much information either on the anthropometric profiles of adults in Costa Rica or on populations that attend swimming programs, this study aims to evaluate anthropometric, physiological, and physical fitness variables in 158 participants enrolled in a swimming program. The study compares the variables with international parameters that will serve as indicators of the population’s general health status, according to sex and age, providing information that will be useful to know the state of health of people who decide to attend a swimming program.
Methodology
This study used a transversal, comparative, and correlational design.
Participants
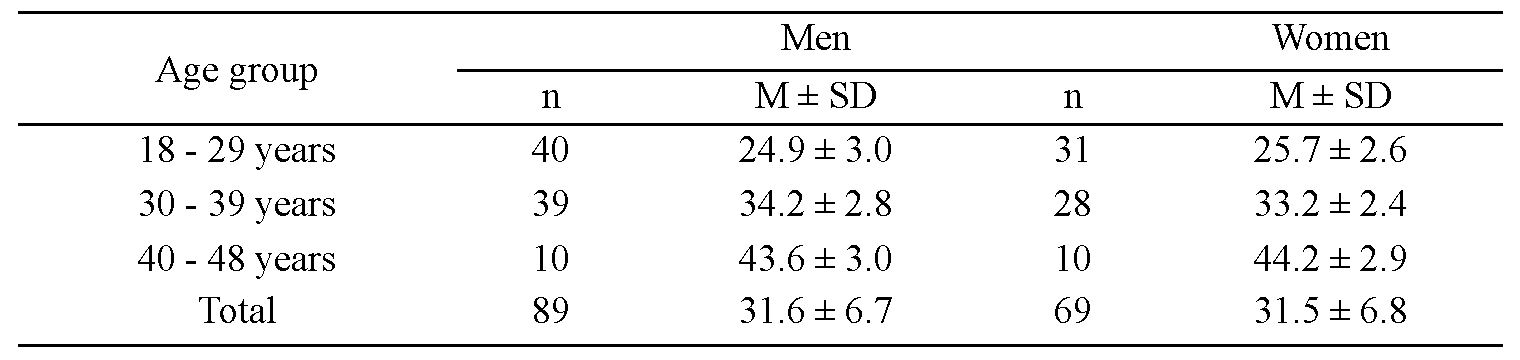
There were 158 participants, 89 men and 69 women (31.5 ± 6.7 years), selected by convenience and distributed in three age groups, which can be observed in Table 1, following the American College of Sport Medicine (2014) categorization. Participants were evaluated at the time of entry into the Swimming for Health Promotion project (Natación para la Promoción de la Salud, NAPROSA), of the Escuela de Ciencias del Movimiento Humano y Calidad de Vida (School of Human Movement Sciences and Quality of Life), at the Universidad Nacional of Costa Rica. Participants were evaluated before starting swimming lessons; this was part of swimming project requirements. The following criteria were considered to select the sample:
they had to be over 18 years of age;
they did not present any type of motor or cognitive disability;
women were not pregnant.
All participants signed an informed consent following the Helsinki Declaration for human research, which explained the purpose of the measurements and the protocols to be used.
Instruments
For the evaluation of the anthropometric and body composition, we used a bioimpedance analysis by InBody 370, model JMW140 (Chungcheongnam-do, South Korea), to determine the body weight, BMI, and BFP, with a level of precision of 98%. Besides, we used a stadiometer (SECA, Hamburg, Germany) to obtain the stature with an accuracy of ± 1mm, and a measuring tape to measure the WC with a precision of ± 1mm. To obtain the data of the physiological variables, specifically the systolic and diastolic blood pressure, an automatic sphygmomanometer (e-sphyg TM2-American Diagnostic Corporation, New York, USA) was used. For the evaluation of physical fitness, the Sit and Reach test was used to evaluate the level of flexibility and the push-up test to evaluate muscular endurance, following the evaluation guidelines published by the American College of Sports Medicine (2014).
Procedure
Each participant had to be evaluated to enter the project; after this, the participants started with the swimming lessons. Each one of them underwent anthropometric evaluations (weight, BMI, BFP, and WC), as well as physiological (SBP and DBP) and physical fitness (flexibility, strength, and muscular strength) examinations. All these evaluations were made in facilities set up with equipment.
For the evaluation, each participant was asked to sit in a chair and to remain at rest for five minutes to measure the blood pressure (SBP and DBP) in the right arm, programming the automatic sphygmomanometer at 220 mm/hg for men and 180 mm/hg for women, with a precision of ±3 mm/Hg. Next, each participant’s height was measured in centimeters. After that, the person proceeded to climb the InBody to perform the bioimpedance analysis from which the weight, BMI, and BFP were obtained. Before each evaluation, all equipment was calibrated. Subsequently, the WC was measured by placing the measuring tape on the upper lateral edge of the hip’s crest. Finally, the participants performed the sit and reach flexibility test and, finally, the push-up test.
Data from the measurements performed to the participants, considering sex and age, were rated as healthy or unhealthy according to the parameters of the American College of Sports Medicine (2014). Values higher than the limits considered as good or normal for each of the variables were deemed as unhealthy data.
Statistical analysis
Descriptive analyzes were performed to obtain the averages, standard deviations, and percentages of each variable. Levene tests were conducted for homogeneity of variances. The Chi-square test was performed to determine the relationship between health status (healthy and unhealthy) with sex and age. The factorial ANOVA 2 (sex) x 3 (age group) was used to determine differences between groups for each dependent variable, in addition to a Bonferroni Post Hoc adjustment test for multiple comparisons to find the differences between the age groups. Pearson correlations were also performed to determine the relationships between the variables. Cohen's effect size (ES) was calculated for significant cases. When ES < .2 is small, .5 is moderate, and > .8 is large. The Statistical Package for Social Sciences (SPSS) (IBM, SPSS Statistics, 18.0 V. Chicago, IL, USA) was used. The significance level used was p< .050.
Results
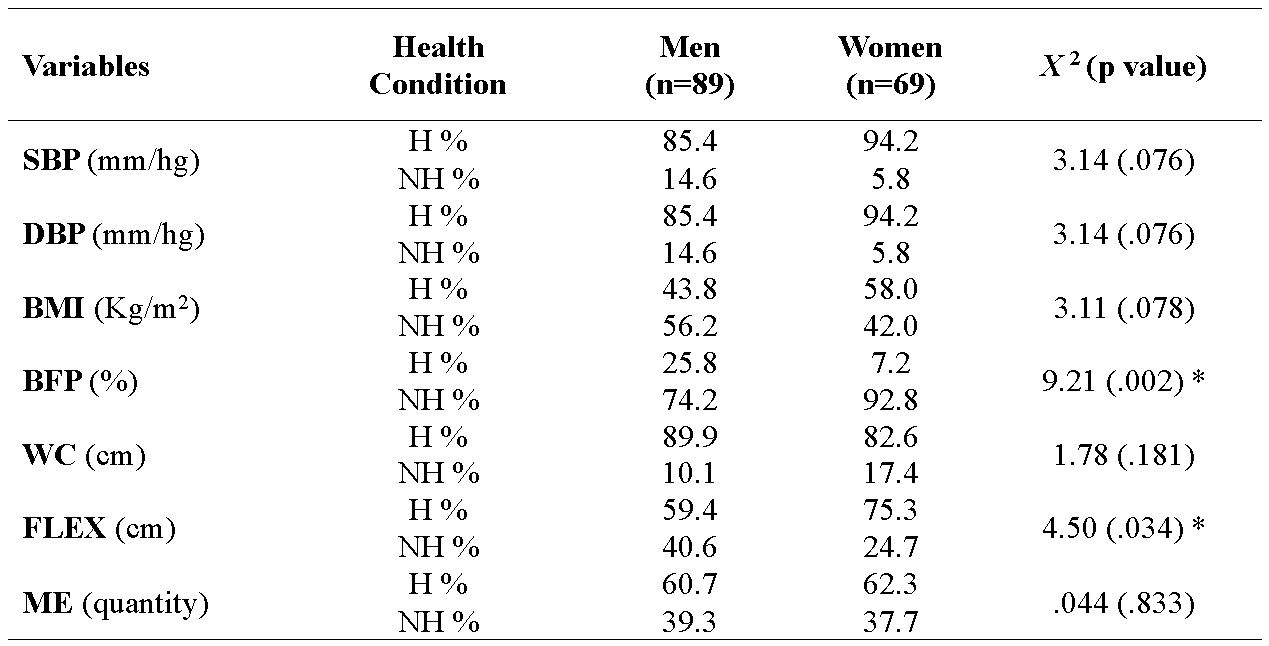
In Table 2, the number of people who presented an unhealthy condition for each variable is shown in percentage. Chi-square inferential analysis showed a statistically significant relationship between participants’ health condition and sex in the percentage of body fat (x2=9.21; p= .002), the percentage of women with unhealthy conditions being higher than men. In the flexibility (x2= 4.50; p= .034), the percentage of people who presented an unhealthy condition was greater in men than in women.
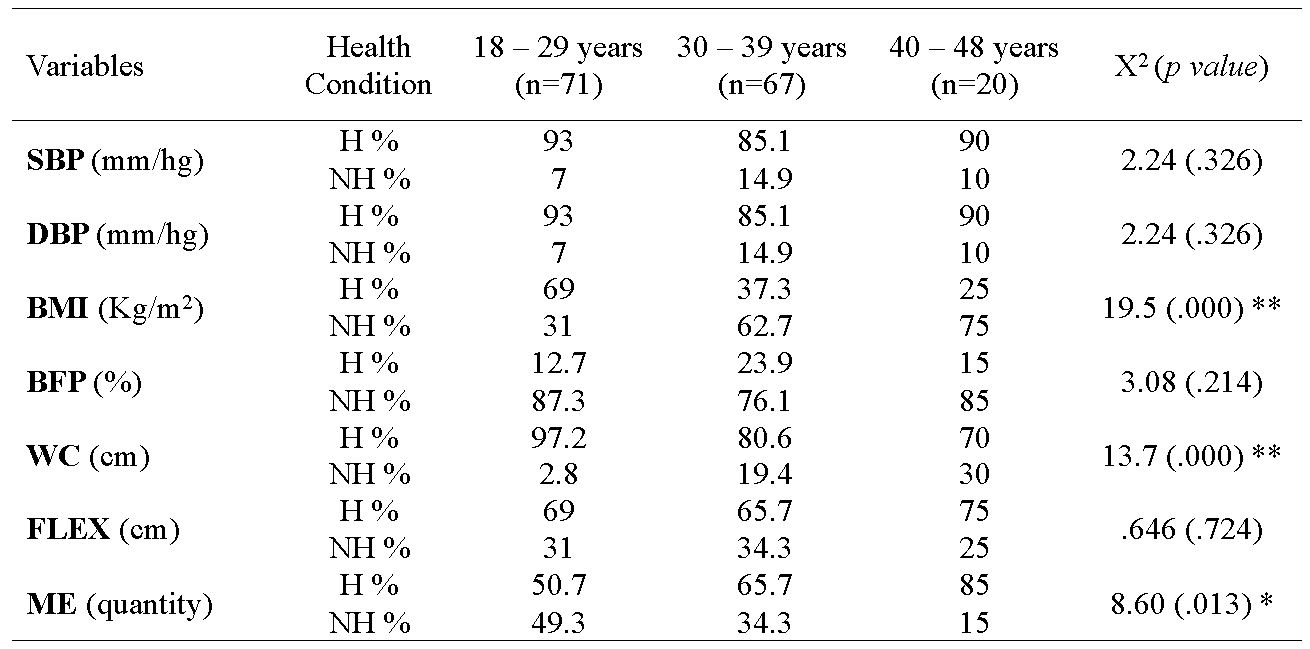
In relation to the age groups in Table 3, we can observe statistically significant relationships in the body mass index (x2= 19.5; p= .000) and waist circumference (x2= 13.7; p= .000), showing the percentage of unhealthy people increases owing to age. As for the number of repetitions performed in the push-ups test, the percentage of people in an unhealthy condition decreased among the oldest age groups (x2= 8.60; p= .013).
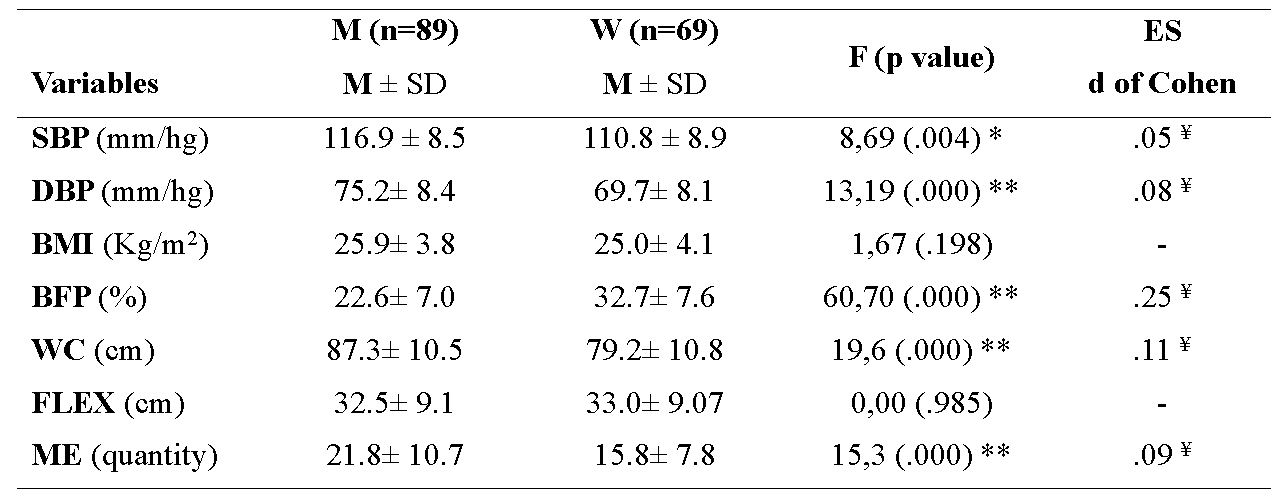
Analysis of factorial ANOVAs showed no significant interactions in any of the variables analyzed. However, Table 4 shows significant differences between men and women in systolic blood pressure (F(5,152)= 8.69; p= .004) and diastolic (F(5,152)= 13.19; p=.000), on waist circumference (F(5,152)= 19.6; p= .000), and in muscular endurance (F(5,152)= 15.3; p= .000), in which men presented higher averages than women. Women showed a higher mean percentage of body fat compared to men (F(5,152)= 60.70; p= .000). There were no significant differences in body mass index and flexibility.
As for the age groups in which the participants were bunch together, Table 5 shows the significant differences in body mass index (F(5,152)= 12.6; p= .000), the fat percentage (F(5,152)= 5.56; p=.004), and the waist circumference (F(5,152)= 15.5; p= .000). The Bonferroni Post-Hoc follow-up test of simple effects found the significant differences between the 18-29 age group with respect to the 30-39 and 40-48 age groups for all three variables. There was also a decrease in the older age groups in the mean of flexibility, although not significantly.
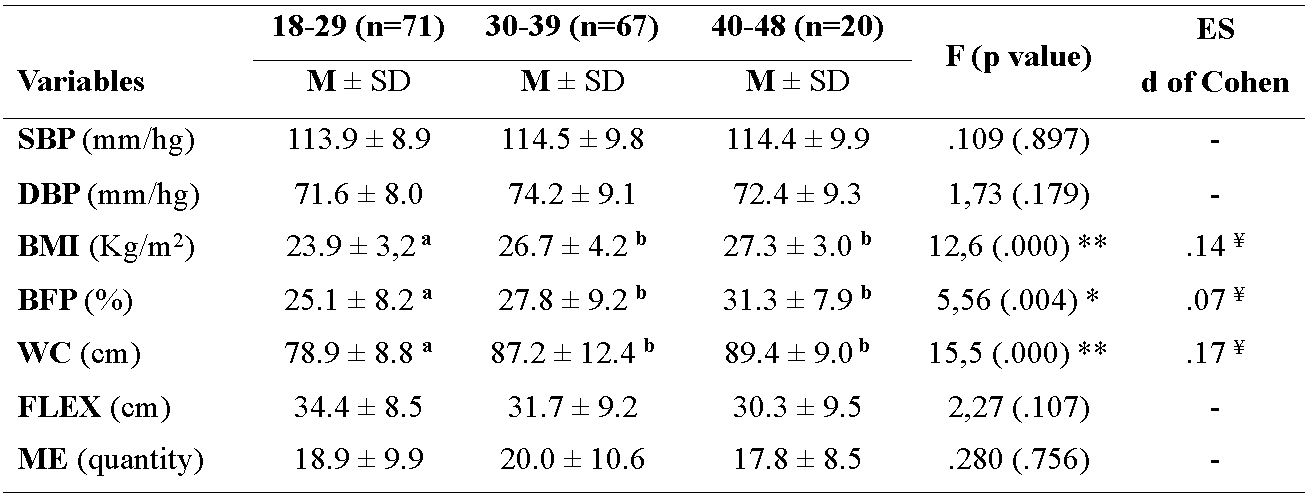
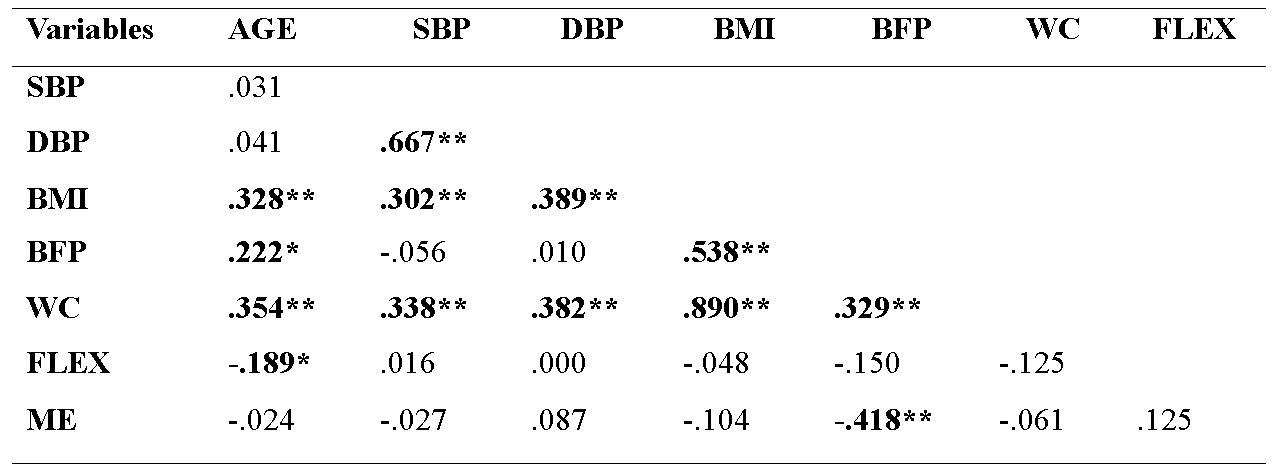
Table 6 shows the positive and significant relationships between the age of the participants and the body mass index (p= .000), fat percentage (p= .005), and waist circumference (p= .000), indicating that, at a higher age, the values in these variables increased, while for flexibility, the correlation was negative (p= .017), indicating that, at an older age this capacity decreased. Among the physiological, anthropometric, and physical fitness variables, correlations were also found. Systolic and diastolic blood pressure correlated significantly with body mass index (p= .000) and waist circumference (p= .000). Regarding the relationship between the anthropometric variables, the body mass index showed a significant and positive relation with fat percentage (p= .000) and waist circumference (p= .000). The fat percentage was negatively related to the physical fitness test of push-ups (p= .000).
Discussion
The purpose of this study was to evaluate anthropometric, physiological, and physical fitness variables in 158 participants of a swimming program according to sex and age. The variables of body mass index, fat percentage, and waist circumference were the measurements in which more than 55% of the individuals presented unhealthy parameters. The data obtained in the present study are similar to other studies carried out in the area of evaluation of physical health components, in which variables such as gender, age, and physical health level (Cartes-Velazquez & Navarrete-Briones, 2012; Secchi & García, 2013; Rivera-Cabezas & Ureña-Bonilla, 2014; Rodríguez-Montero et al., 2014; Rojas-Valverde et al, 2016) were considered. The values obtained in this study in relation to the variables of body mass index and percentage of fat, categorized as unhealthy, are congruent with those reported in previous research studies (Chistofaro et al., 2011; Michelotto et al., 2010). The mean values in these variables for both sexes correspond to parameters that are representative of overweight and obesity, due to an excess of body fat in both men and women and according to age (Corvos-Hidalgo & Corvo-Hidalgo, 2013). In the case of systolic and diastolic blood pressure, the parameters reported in this study as unhealthy correspond to a condition of prehypertension (Castillo et al., 2011; Škrkar et al., 2015). Pre-hypertension, as well as unhealthy body mass index and fat percentage, can be considered as cardiovascular risk factors and metabolic syndrome (Liu et al., 2013; Tejero, 2010).
According to the sex of the variables, the results, coincide with those mentioned in the scientific literature. In the case of systolic and diastolic blood pressure values obtained by men are higher than those obtained by women (Castillo et al., 2011; Restrepo et al., 2012). This difference between the sexes is common before women reach menopause, due to genetics and the functioning of hormones such as estrogens, which in women help control blood pressure, whereas in men, testosterone does not meet this function (Sandberg & Ji, 2012).
Regarding the percentage of body fat, the women presented higher values compared to men. Previous studies have shown that the female organism has a predisposition to accumulate more fatty tissue due to biochemical processes, which causes the metabolism to be slower in fat degradation (Cossio-Bolaños et al., 2011; Liu et al., 2013; Michelotto et al., 2013; Padilla, 2014; Piernas et al., 2008).
Measurements of waist circumference were significantly lower in females than in males. The fact that men have values higher than women may be due to body mass index, because this measurement has been associated with an observable parameter of localized abdominal obesity for men (Michelotto et al., 2013), while for women fat accumulation in the abdominal and visceral area is limited by its anatomical structure at the hip level, causing fat concentrations in other areas, such as the lower limbs (Piernas et al., 2008).
The results of physical fitness tests between men and women in this study were very similar to those reported in other studies (García-Soidán & Alonso-Fernández, 2011; Ramos et al., 2009). In the muscle strength and endurance test, men performed a significantly greater number of repetitions compared to women, due to a greater amount of muscle mass presented by men, which allows them to obtain better results in this type of tests (Esco et al., 2008; Zaragoza et al., 2004). No significant differences were found in flexibility between sexes, although the average for men was slightly lower; this is a tendency also observed in other studies, mainly due to a greater elasticity in women muscle fibers (Bernavent et al., 2008; Delgado et al., 2009; García & Aznar, 2011).
As for the influence of age on the variables analyzed, the results of this study are in agreement with those obtained in other similar studies that show, for the anthropometric variables, values classified as unhealthy in the oldest age groups (Cartes-Velazquez & Navarrete-Briones, 2012; Rivera-Cabezas & Ureña-Bonilla, 2014; Rodríguez-Montero et al., 2014), which may be due to the body's inability to metabolize fat as age increases, as well as the loss of total muscle mass and bone density and to the habits of life, food and the amount of physical activity, which are neglected at an older age, affecting the processes of fat metabolization by the body that causes them to accumulate more easily in the body (Chuang et al., 2012; Dunsky et al., 2013; Ranasinghe et al., 2013).
The flexibility showed a decrease in the older participants coinciding with that reported by previous studies, which determined that the muscles lose their elasticity and the joints their ranges of mobility as age increases (Bernavent et al., 2008; Delgado et al., 2009; Varquero et al., 2012).
On the other hand, when analyzing the correlations between the variables, it was observed that the values of the physiological variables showed a direct relation with the values of body mass index, and waist circumference, which supports that obesity, overweight and excess abdominal fat are factors that increase the chances of developing high blood pressure in populations (Ahmad et al., 2011; Christofaro et al., 2011), owing to the body fat is lodged more easily in the arteries generating an increase in the peripheral arterial resistance (Gasparotto et al., 2009; Michelotto et al., 2010; Santos et al., 2012).
Regarding physical fitness variables, muscle endurance correlated significantly but negatively with fat percentage, confirming what has been shown in previous studies that indicate that performance in muscle endurance tests is negatively affected by a percentage of unhealthy body fat (Ramos et al., 2009; Vaara et al., 2012). This percentage can be associated with the increase of the body weight that generates the accumulation of fat in the body, requiring a greater effort to overcome one's own body weight (Vaara et al., 2012), as in the case of the push-ups test (Esco et al., 2008).
Limitations
One of the limitations of this study was not having obtained the level of physical activity performed by the participants who were evaluated before entering the project; this situation limited the possibility of knowing if the participants were sedentary or physically active, which could have been a factor that would influence the results presented. Another limitation of this study was not having had follow-up data after a time of having started swimming to determine the effect of swimming on the evaluated indicators.
Conclusion
The percentage of fat, body mass index, and waist circumference are shown as the variables in which more people presented unhealthy parameters. Age and sex are factors that influence the behavior of anthropometric, physiological, and physical fitness variables. At a higher age, there is a higher percentage of body fat, greater waist circumference, and a higher BMI in both sexes. Women show a greater accumulation of body fat, while men have higher waist circumference values when compared between sexes. The high values of these indicators are associated with the risk of developing metabolic and cardiovascular effects. Men have better values in muscular endurance than women. Finally, it is necessary to promote healthy lifestyles, as well as the regular practice of physical activity, to impact and improve the quality of life of adult populations. For this, the physical exercise programs in the aquatic environment are positioned as an option that provides the opportunity to promote physical activity in society.
References
American College of Sports Medicine (2014). ACSM Manual for Assessment of Health Related Fitness. (4th. Ed). Barcelona, España: Wolters Kluwer Health.
Ahmad, R., Raham, S., Zaman, F., & Jan, S. (2011). Percent body fat and its relationship with obesity and hypertension in adult Population of Mingora Swat. Gomal Journal of Medical Sciences, 9(11), 120-123. http://www.gjms.com.pk/ojs24/index.php/gjms/article/viewFile/353/305
Arteagal, A., Bustos, P., Soto, R., Velasco, N., & Amigo, H. (2010). Physical activity and its association with cardiovascular risk factors. A study in young adults. Revista Médica de Chile, 138, 1209-1216. http://www.scielo.cl/pdf/rmc/v138n10/art%2001.pdf
Beaney, T., Schutte, A. E., Tomaszewski, M., Ariti, C., Burrell, L. M., Castillo, R. R., ... & Nilsson, P. M. (2018). May Measurement Month 2017: an analysis of blood pressure screening results worldwide. The Lancet Global Health, 6(7), e736-e743. https://doi.org/10.1016/S2214-109X(18)30259-6
Benavent, J., Tella, V., González-Millan, I., & Colado, J. C. (2008). Comparação de diferentes testes de campo para a avaliação da flexibiliade geral ativa. Fitness & Performance Journal, 7(1), 26-29. https://doi.org/10.3900/fpj.7.1.26.p
Campos-Nonato, I., Hernández-Barrera, L., Rojas-Martínez, R., Pedroza, A., Medina-García, C., & Barquera-Cenera, S. (2013). High blood pressure: prevalence, timely diagnosis, control and trends in Mexican adults. Salud Publica Mexicana, 55(supl2), 144-150. PMID:24626690
Castillo, Y., Cháves, R., Fernández, J., Alfonzo, J. M., & Alfonzo, P. (2011). Incidence and prevalence of arterial hypertension recorded in the world day of hypertension 2011. Experience of a working group. Revista Cubana de Medicina, 51(1), 25-34. http://scielo.sld.cu/scielo.php?script=sci_arttext&pid=S0034-75232012000100004
Cartes-Velásquez, R. & Navarrete-Briones, C. (2012). Anthropometric characterization of adult pehuenche population, nutritional considerations. Alto Biobio, Chile. Mem. Inst. Investig. Cienc. Salud, 10(2), 30-37. http://scielo.iics.una.py/pdf/iics/v10n2/v10n2a04.pdf
Corvos-Hidalgo & Corvos-Hidalgo (2013). Anthropometric parameters as indicators of health risk in university students. Nutrición Clínica y Dietética Hospitalaria, 33(2), 39-45. https://doi.org/10.12873/3323945
Cossio-Bolaños, A., Arruda, M., Moyano, A., Gañán, E., Pino, L., & Lancho, A. (2011). Body composition of university students in relation to health. Nutrición Clínica y Dietética Hospitalaria, 31(3), 15-21. https://revista.nutricion.org/PDF/Composicion-corporalCossio.pdf
Chuang, H. H., Li, W, C., Sheu, B, F., Liao, S, C., Chen, J. Y., Chang, K. C., & Tsai, Y. W. (2012). Correlation between body composition and risk factors for cardiovascular disease and metabolic syndrome. Research Communication, 38(8), 284-291. https://doi.org/10.1002/biof.1027
Christofaro, D. G. D., Ritti-Dias, R. M.; Fernandes, R. A.; Polito, M. D.; de Andrade, S. M.; Cardoso, J. R.; & Ramos de Oliveira. A. (2011). Detecção de hipertensão arterial em adolescentes através de marcadores gerais e adiposidade abdominal. Arquivos Brasileiros de Cardiologia, 96(6), 465-470. http://www.scielo.br/pdf/abc/v96n6/aop04411_port.pdf
Delgado, O., Martín, M. A., Zurita, F., Antequera, J. J., & Fernández, M. (2009). Evolution of flexor ability according to sex and level of education. Apunts Medicine de L´Esport, 161, 10-17. http://www.apunts.org/es/evolutividad-capacidad-flexora-segun-el/articulo/13135385/
Dunsky, A., Zach, S., Zeev, A., Goldbourt, U., Shimony, T., Goldsmith, R., & Netz, Y. (2014). Level of physical activity and anthropometric characteristics in old age—results from a national health survey. European Review of Aging and Physical Activity, 11(2), 149-157. https://doi.org/10.1007/s11556-014-0139-y
Esco, M. R., Olson, M. S., & Williford, H. (2008). Relationship of push-ups and sit-ups tests to selected anthropometric variables and performance results: A multiple regression study. Journal of Strength and Conditioning Research, 22(6), 1862–1868. https://doi.org/10.1519/JSC.0b013e318181fd03
Espinoza-Navarro, O., Brito-Hernández, L., & Lagos-Olivos, C. (2020). Composición corporal y factores de riesgo metabólico en profesores de enseñanza básica de colegios de Chile. International Journal of Morphology, 38(1), 120-125. http://dx.doi.org/10.4067/S0717-95022020000100120
Fedewa, M. V., Nickerson, B. S., & Esco, M. R. (2019). Associations of body adiposity index, waist circumference, and body mass index in young adults. Clinical Nutrition, 38(2), 715-720. https://doi.org/10.1016/j.clnu.2018.03.014
García, P. T. & Aznar, L. A. (2011). Pilates method: changes in body composition and spinal flexibility in healthy adults. Apunts Medicine de L´Esport, 46(169), 17-22. https://doi.org/10.1016/j.apunts.2010.07.001
García-Soidán, J. L. & Alonso-Fernandez, D. (2011). Valuation of healthful physical condition in university students of Galicia. Revista Internacional de Medicina y Ciencias de la Actividad Física y el Deporte, 11(44), 781-790. http://cdeporte.rediris.es/revista/revista44/artvaloracion247.htm
Gasparotto G. S., Silva M. P., Bozza R., Stabelini Neto A., Campos W, Bonfim A. L., & Costa A. (2009). Atividade física e indicadores antropométricos relacionados com a hipertensão arterial em mulheres. Fitness and Performance Journal, 8(5), 322-328. doi:10.3900/fpj.8.5.322.p
Liu, P., Ma, F., Lou, H., & Liu, Y. (2013). The utility of fat mass index vs body mass index and percentage of body fat in the screening of metabolic syndrome. BMC Public Health, 13(629), 1-9. https://doi.org/10.1186/1471-2458-13-629
Michelotto, M., Martins, R., Machado, E., Santos, E. & Carvalho, T. (2010). List of anthropometric indicators with risk factors for cardiovascular disease. Arquivos Brasileiros de Cardiologia, 94(4). http://www.scielo.br/pdf/abc/v94n4/es_aop00610
Padilla, J. (2014). Relationship of body mass index and body fat percentage in young venezolanos. Revista Iberoamericana de Ciencias de la Actividad Física y el Deporte, 3(1), 27-33. https://riuma.uma.es/xmlui/bitstream/handle/10630/7547/IMCPadilla.pdf?sequence=1
Piernas, C., Hernández-Morante, J. J., Canteras, M., Zamora, S., & Garaulet, M. (2008). New computed tomography-derived indices to predict cardiovascular and insulin-resistance risks in overweight/obese patients. European Journal of Clinical Nutrition, 63, 887-897. https://doi.org/10.1038/ejcn.2008.47
Ramos, S., Alzate, D., Ayala, J., Franco, A. M., & Sánchez, J. A. (2009). Fitness profile of Universidad de Caldas students. Revista Hacia la Promoción de Salud, 14(1), 23-34. http://www.scielo.org.co/pdf/hpsal/v14n1/v14n1a02.pdf
Ranasinghe, C., Gamage, P., Katulanda, P., Andraweera, N., Thilakarathn, S., & Tharanga, P. (2013). Relationship between Body mass index (BMI) and body fat percentage, estimated by bioelectrical impedance, in a group of Sri Lankan adults: a cross sectional study. BMC Public Health, 13 (797), 1-8. https://doi.org/10.1186/1471-2458-13-797
Restrepo, C., Agudelo, J. C., Conde, L. E., & Pradilla, A. (2012). Blood pressure by age, gender, height, and socioeconomic level in school populations in Cali, Colombia. Colombia Medica, 43(1), 63-72. http://www.bioline.org.br/pdf?rc12008
Rivera-Cabezas, G. & Ureña-Bonilla, P. (2014). Indicadores antropométricos en un centro de acondicionamiento físico urbano de la provincia de Heredia. RMHSalud: Revista en Ciencias del Movimiento Humano y Salud, 11(1), 1-12. http://dx.doi.org/10.15359/mhs.11-1.1
Rivera, G., Ureña, P., Fernández, G., Quesada, T., Gómez, D. (2017). Evaluación antropométrica-fisiológica de trabajadores de la Universidad Nacional de Costa Rica: un análisis comparativo regional (pág. 132). En Roma Ferri, M. Teresa; Arroyo, Hiram V.; Aguilo Pons, Antoni (coord.). Actas del Congreso Iberoamericano de Universidades Promotoras de la Salud (CIUPS 2017): Promoción de la Salud y Universidad. Construyendo Entornos Sociales y Educativos Saludables, Universidad de Alicante (España). http://hdl.handle.net/10045/67141
Rodríguez-Montero, A., Ureña-Bonilla, P., Blanco-Romero, L., Sánchez-Ureña, B., & Salas-Cabrera, J. (2014). Anthropometricó and physical fitness indicators related to Costa Rican employee´s health. Revista Costarricense de Salud Pública, 23(1) 25- 31. http://www.scielo.sa.cr/pdf/rcsp/v23n1/art05v23n1.pdf
Rojas-Valverde, D., Arce-Varela, E., Suárez-Orozco, Y., Moya-Castro, D., Barrantes-Segura, M., Cambronero-Steller, F., & Molina-DeBernardi, M. (2016). Gender differences in the physical aptitude of adults who attend to a recreation center of Costa Rica. Revista Movimiento Científico, 10(1), 39-53. https://revistas.iberoamericana.edu.co/index.php/Rmcientifico/article/download/1135/882
Sandberg, K. & Ji, H. (2012). Sex differences in primary hypertension. Biology of Sex Differences 3(7), 1-21. https://doi.org/10.1186/2042-6410-3-7
Santos, D., Petroski, E., & Peres, M. (2012). Is high body fat estimated by body mass index and waist circumference a predictor of hypertension in adults? A population-based study. Nutrition Journal, 11, 1-9. https://doi.org/10.1186/1475-2891-11-112
Secchi, J. & García, G. (2013). Cardiorespiratory Fitness and Cardiometabolic Risk in Young Adults. Revista Española de Salud Pública, 87(1), 35-48. http://scielo.isciii.es/pdf/resp/v87n1/05_original3.pdf
Silva-Batista, C., Urso, R. P., Silva, A. E. L., & Bertuzzi, R. (2013). Associations between fitness tests and the International Physical Activity Questionnaire-Short form in healthy men. The Journal of Strength & Conditioning Research, 27(12), 3481-3487. https://doi.org/10.1519/JSC.0b013e31828f1efa
Škrkar, S., Mikalack, M., Cokorilo, N., & Eric, M. (2015). Analysis of differences in blood pressure of women belonging to different age groups. Med Pregl LXVIII (3-4), 93-97. https://doi.org/10.2298/MPNS1504093S
Tejero, M. E. (2010). Cardiovascular disease in Latin American women. Nutrition, Metabolism & Cardiovascular Diseases 20, 405-411. https://doi.org/10.1016/j.numecd.2010.02.005
Vaquero, R., González, I., Ros, E. & Alacid, F. (2012). Evolution of strength, flexibility, balance, endurance and agility of active older women in relation to age. Motricidad. European Journal of Human Movement, 29, 29-47. http://www.redalyc.org/articulo.oa?id=274224827003
Vaara, J. P., Kyröläinen, H., Niemi, J., Ohrankämmen, O., Häkkinen, A., Kocay, S., & Häkkinen, K. (2012). Associations of maximal strength and muscular endurance test scores with cardiorespiratory fitness and body composition. Journal of Strength & Conditioning Research, 26(8), 2078-2086. https://doi.org/10.1519/JSC.0b013e31823b06ff
Urrea, J. K. (2018). Hipertensión arterial en la mujer. Revista Colombiana de Cardiología, 25, 13-20. https://doi.org/10.1016/j.rccar.2017.12.003
Wang, Y., Howard, A. G., Adair, L. S., Wang, H., Avery, C. L., & Gordon‐Larsen, P. (2020). Waist circumference change is associated with blood pressure change independent of BMI change. Obesity, 28(1), 146-153. https://doi.org/10.1002/oby.22638
Zaragoza, J., Serrano, E., & Generelo, E. (2004). Dimensions of the heatlhy physical fitness: Evolution for age and gender. Revista Internacional de Medicina y Ciencias de la Actividad Física y el Deporte, 4(15), 204-221. http://cdeporte.rediris.es/revista/revista15/artdimensiones.htm
