Artículos
Biochemical and Physiological Responses in Sedentary Subjects During the Evaluation of Maximum Oxygen Uptake
Respuestas funcionales durante una prueba de consumo máximo de oxígeno en sujetos sedentarios
Respostas funcionais durante um teste de absorção máxima de oxigênio em indivíduos sedentários
 Jesús León Lozada Medina Jesusleon.lm@gmail.com
José Rafael Padilla Alvarado Joserafael.pa@gmail.com
Manuel de Jesús Cortina Núñez mjcortinanunez@correo.unicordoba.edu.co
Jesús León Lozada Medina Jesusleon.lm@gmail.com
José Rafael Padilla Alvarado Joserafael.pa@gmail.com
Manuel de Jesús Cortina Núñez mjcortinanunez@correo.unicordoba.edu.co
Biochemical and Physiological Responses in Sedentary Subjects During the Evaluation of Maximum Oxygen Uptake
MHSalud, vol. 20, núm. 1, pp. 1-14, 2023
Universidad Nacional

Esta obra está bajo una Licencia Creative Commons Atribución-NoComercial-SinDerivar 3.0 Internacional.
Recepción: 14 Abril 2021
Aprobación: 13 Octubre 2022
Abstract:
Introduction: The use of incremental exercise tests (IET) to evaluate the individual’s acute responses is an essential tool in Physical Activity Science.
Objective: This paper aims to analyze the behavior between biochemical and physiological variables as aerobic-anaerobic transition indicators during two incremental exercise tests, which measure the maximum oxygen uptake in healthy subjects.
Methodology: The sample consisted of two individuals, who were thirty-three and twenty-five years old, respectively. During the execution of the tests, the following materials and tools were used: a portable glucometer, a portable lactometer, reactive tapes, a treadmill, a stationary Cycle Ergometer Monark®, a heart rate monitor Polar®, a gas analyzer, software Breeze®, a computer, tools for recording data, and a pencil.
Results: the high inverse correlation between the Glycemic index and VO2 (r: -0,853) and the Glycemic and CO2 (r: -0,851) are notable. Moreover, the detection of thresholds for each subject through blood lactate invasive and non-invasive methods, such as heart rate (HR), is also shown.
Conclusion: A clear explanation of Respiratory Quotient (RQ) behavior is given during the Cycle-ergometer test, concluding that this type of protocol is safe for the group under study and that the validity of the results is in accordance with theoretical expectations.
Keywords: lactic acid, aerobic exercise, heart rate, blood glucose.
Resumen:
Introducción: La ejecución de pruebas físicas incrementales para evaluar las respuestas agudas del individuo, representa una herramienta fundamental en el área de las ciencias de la actividad física.
Objetivo: En este sentido, el presente trabajo tiene como objetivo el análisis del comportamiento entre variables bioquímicas y fisiológicas como indicadores de la transición aerobio-anaeróbica en la ejecución de dos test incrementales que miden el consumo máximo de oxígeno, en sujetos sedentarios.
Metodología: La muestra se conformó por dos individuos, los cuales presentan edades de treinta y tres y veinticinco años, respectivamente. En el desarrollo de la prueba se utilizaron los siguientes materiales e instrumentos: un glucómetro portátil, un lactómetro portátil, cintas reactivas, treadmill, cicloergomertro Monark ®, pulsometro marca polar ®, analizador de gases, software Breeze ®, computador, instrumentos de registro de datos y lápiz.
Resultados: destacan la alta correlación inversa presente entre los valores de glicemia y VO2 (r: -0,853), así como Glicemia y CO2 (r: -0,851) del mismo modo se muestra la detección de los Umbrales para cada sujeto mediante métodos invasivos del lactacidemia y no invasivos como la frecuencia cardíaca.
Conclusión: También se ejecuta una explicación clara del comportamiento del cociente respiratorio en la prueba ejecutada con el cicloergómetro, concluyendo que este tipo de protocolos son seguros para el grupo en estudio y la validez de los resultados es acorde con las expectativas teóricas.
Palabras clave: ácido láctico, ejercicio aeróbico, frecuencia cardiaca, glucosa en sangre.
Resumo:
Introdução: A execução de testes físicos incrementais para avaliar as respostas agudas do indivíduo representa uma ferramenta fundamental na área das ciências da atividade física.
Objetivo: Neste sentido, o presente trabalho visa analisar o comportamento entre as variáveis bioquímicas e fisiológicas como indicadores da transição aeróbico-anaeróbica na execução de dois testes incrementais que medem o consumo máximo de oxigênio em sujeitos sedentários.
Metodologia: A amostra consistiu de dois indivíduos, com trinta e três e vinte e cinco anos de idade, respectivamente. Os seguintes materiais e instrumentos foram utilizados no desenvolvimento do teste: um glicosímetro portátil, um lactômetro portátil, tiras de teste, esteira, cicloergômetro Monark®, pulsômetro polar®, analisador de gás, software Breeze®, computador, instrumentos de registro de dados e lápis.
Resultados: A alta correlação inversa entre glicemia e VO2 (r: -0,853), assim como glicemia e CO2 (r: ‑0,851) e a detecção dos limiares para cada sujeito usando métodos invasivos como lactacidemia e métodos não-invasivos como a frequência cardíaca.
Conclusão: Uma explicação clara do comportamento do quociente respiratório no teste executado com o cicloergômetro também é executada, concluindo que este tipo de protocolos são seguros para o grupo em estudo e a validade dos resultados está de acordo com as expectativas teóricas.
Palavras-chave: ácido láctico, exercício aeróbico, frequência cardíaca, glicose no sangue.
Introduction
The individual’s capacity to tolerate prolonged intensive exercises by keeping stable physiological conditions has been a theme of study since the beginning of the 20th century. Since then, many proposals have been presented, such as the one offered by Hill and cols. in 1924 (as cited in López Chicharro & Mojares, 2008) when they suggested that a deficiency of oxygen in active muscles caused the increase observed in the blood lactate concentration. Subsequently, in 1930, Owles (as cited by Viru & Viru, 2001) mentioned the critical metabolic level over which a progressive increase in lactate concentrations was produced.
Later, in 1964, Wasserman and Mcllroy (as cited by López Chicharro & Mojares, 2008) demonstrated the possibility of detecting the exercise intensity in which the energetic metabolism changes and the anaerobic fraction participates actively in offering energy to the active muscle during the exercise.
Besides the previous proposals, non-invasive proposals exist, such as Conconni’s in 1982 (as cited by Sergueyevich & Dmitriyevich, 2005). His objective is practical based on the determination of the maximum value according to figure HR (Heart rate)-Power. In the same way, in 1982, Orr, Greenn, Hughson, and Bennett (as cited by Subiela, 2007) set up two execution levels based on parameters derived from a respiratory exchange, which were named ventilatory thresholds 1 and 2.
This study aims to analyze the functional responses during a maximal oxygen consumption test in healthy subjects.
The degradation of the glucose in the cytoplasmic environment, either integrated as circulating glucose or by isomerization as glycogen, initiates the process, which ends partially with pyruvate production. This process, called glycolysis, consists of an invariable succession of 11 chemical reactions that entail the final pyruvate production.
The pyruvate could take multiple paths at the end of this first chemical reaction sequence. It could either resume the carbohydrate degradation in what is called biological oxidation or could be a precursor of other products and metabolic processes, such as the portion reduced to form lactate, which depends on various factors (Robergs et al., 2018).
It is important to mention that lactate is the salt of lactic acid. It is formed when the lactic acid loses hydrogen ions (H+), and the rest of its components join sodium (Na) and potassium (K) ions in order to form salts (sodium and potassium lactate). Nowadays, advances in physical activity science have explained the definitions of lactate and lactate acid and the distinctions between them. When referring to carbohydrate energetic metabolism products and processes, it is clear that the metabolite produced is the lactate of those physiological environments (Robergs et al., 2004).
It is evident that the lactate cannot exit the muscle and enter the blood by itself. Instead, it uses a transport by the sarcolemma; López-Chicharro & Lucía-Mulas (1996) explained that the lactate/H+ cotransport (monocarboxylate transporters, MTC) is the main responsible for the lactate moving across the sarcolemma, although there exists a simple diffusion of non-dissociated lactate, with the purpose of always reconverting itself to produce energy. This process is important for exercise response and adaptation practice because lactate conversion to pyruvate is only possible in those muscle fibers that have the biochemical disposition to the HLDH isoenzyme of the lactate dehydrogenase complex. The lactate dehydrogenase complex is composed of five isoenzymes in total, with the capacity to make the reduction process reversible and, therefore, oxidize the lactate in order to reconvert the pyruvate and take advantage of the energy in this metabolite by an aerobic process (Roig, 2002).
The pyruvate complex, which boosts the reduction to lactate by LDH complex action, is today understood as one muscle cell’s buffer capacity. This is because lactate acts as a proton acceptor from the pyruvate, and these are initially derived from the glycolytic process (Robergs et al., 2004; Roig, 2002).
The protein capacity of Nicotinamide adenine dinucleotide (NAD)+H to transport protons to the mitochondrion, together with lactate generation, becomes the mechanism that buffers the proton power in the cytoplasm. For this reason, avoiding or postponing a pH failure affects the enzymatic system function and the athletic performance capacity. This current approach has helped redesign traditional notes or paradigms that supported, for many decades, the production of lactic acid in human muscle in physiological conditions. In addition, it notes that lactic acid is responsible for metabolic acidosis and, therefore, it is responsible for muscle fatigue during high-intensity exercise (Mata et al., 2012).
The inability to revert the lactate to pyruvate in the glycolytic fibers FT (Roig, 2002) will make the fibers look full of lactate and, in this, will create the necessity to transfer the metabolic agents towards the bloodstream where it reacts with the bicarbonate of soda in order to form the non-metabolic carbon dioxide (CO2). López Chicharro & Mojares (2008) explained that the high demand from physical activity could decrease pH to 6.8 in plasma and 6.3 in muscle due to proton concentration when buffering mechanisms that have exceeded their capacity (threshold point).
According to Heck, Mader, and Hollman, 1980 (as cited in Subiela, 2007), the anaerobic threshold is created starting at 4mmol/L concentration and is considered the aerobic-anaerobic limit. This value represents an average in which a healthy and athletic individual could keep his/her physiological conditions stable during a long-term workout. However, it is important to highlight that the intensity to reach the threshold of 4mmol/L is an individual condition. In trained individuals, this inflection point in the lactate curve represents around 80% of VO2, whereas in untrained ones, it represents almost 60% of VO2 (Subiela, 2007).
Monitoring the patient can also be taken into consideration. During the incremental test, the heart rate (HR) is considered a useful variable to detect the aerobic-anaerobic transition zone. In this sense, according to Conconi, 1982 (as cited in Sergeyevich & Dmitriyevich, 1995), in a specific moment, the increase of HR tends to reduce a little if the exercise power keeps increasing. This point was called the “deflection point” because the physical activity intensity was the maximum intensity that could be reached with the predominance of aerobic supply.
On the other hand, the respiratory quotient (RQ) behavior is also considered. The RQ is based on the assumption that the relationship between CO2 produced and O2 consumed shows a real gas exchange of nutrient metabolism at a cellular level. In this sense, during inactivity or low-intensity exercises, this exchange keeps standard levels depending on the food consumption. Therefore, this exchange will be determined by the reaction to a certain type of food oxidation; it could be placed in carbohydrates (1.00), lipids (0.70), proteins (0.82), and mixed diet (between 0.70 to 1.00) (Katch et al., 2015).
Authors highlight that the increase of RQ over 1.00 could not be attributed to food oxidation but to the reaction to lactate in plasma, which produces a weak acid named carbonic acid (H2CO3). In the pulmonary capillaries, the carbonic acid H2CO3 (a weak acid) decomposes into CO2 y H2O; thus, the CO2 is exhaled easily by the lungs. Finally, the particularity of RQ is mentioned because it increases over 1.00 because the attenuation or buffer effect adds more CO2 (non-metabolic) to the exhaled air than the regular one existing in the energetic cellular metabolism.
Methodology
Methodological design
This study was conducted using case study research supported by a quantitative paradigm. Due to its level and nature, the research is descriptive and cross-sectional.
Population and sample
The population consisted of two male individuals. The subjects were 25 (subject 1) and 33 years old (subject 2). The sample was the same as the population, obtained by intentional sampling.
Procedure
In accordance with the protocol of Helsinki, the subjects were previously informed about the procedure of the activities and their rights before, during, and after the test. During the experiment, the participants were planned to have healthy meals for lunch at 12:30 pm. After three hours of rest, the lactate was checked using a blood test by pricking their fingers with lancets. The samples were pre-test for both participants, and there were controls at the end of every stage of the tests. Likewise, the behavior of HR and the gas register for both subjects were monitored. It is important to clarify that both subjects executed incremental tests with different protocols for each one of them as follows:
Subject 1 used a cycle ergometer Monark ®. He started the test with a load of 10 watts and then increased 10 more watts every three minutes with a constant pedal power at 50 revolutions per minute (rpm). VO2, CO2, and RQ were evaluated directly with a gas analyzer. The use of the Bohr scale permitted to establish power perception and its relation with HR during exercises and with the values of VO2 (Mahler et al., 2005)
Subject 2 used a treadmill and carried out the test of the University of Montreal (Bosquet et al., 2002). This test was designed in two stages of two minutes each and initiated at 8 Km/h with an increase of 1 Km/h per stage. This time, the relative VO2 was estimated through the following formula: VO2: 22.859 + (1.91 x speed in km/h) – (0.8664 x age) + (0.0667 x speed in km/h x age). The speed corresponds to the one registered during the last stage.
Materials
The following tools and materials were used during the execution of the test: a portable glucometer, a portable lactometer, reactive tapes, a treadmill, a stationary Cycle Ergometer Monark ®, heart rate monitors Polar ®, a gas analyzer, the software Breeze ®, a computer and tools for recording data, and a pencil.
Statistical model
The descriptive technique was used for the data analysis, which permitted average estimation, minimum and maximum values, typical deviation, and coefficients of variation. The analysis was carried out with the Statistical Package for the Social Sciences (SPSS) version 23.0 for windows.
Results
Subject 1
The descriptive statistics demonstrated the results of the eleven stages (see Table 1), which were carried out by subject one. The protocol of the cycle ergometer increased by 10 watts every three minutes.
Increased depletion of muscle glycogen would soon request higher participation of liver glycogen. Also, with the extension of combined effort and higher power, the circulating glycogen (López Chicharro & Mojares, 2008) would be compromised, as it is show in Figure 2 about glycemic behavior.
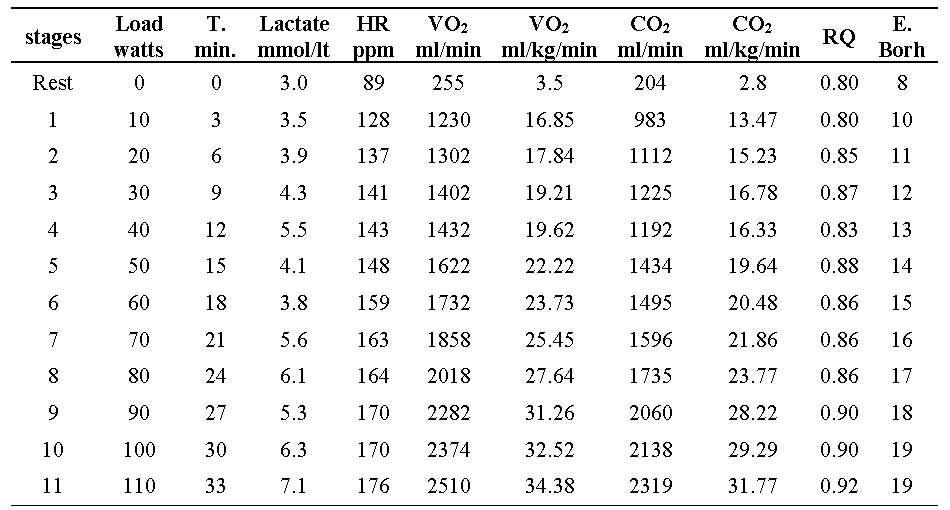
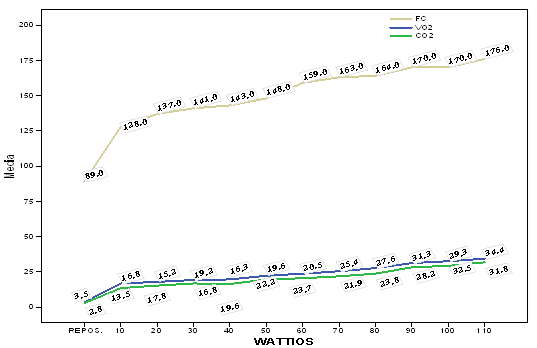
Figure 1
Curves that represent the HR (beat/min), the VO2 (ml/kg/min), and the CO2 (ml/kg/min) during the incremental test in the Cycle Ergometer
Regarding the HR physiological parameter, it was possible to observe the inflexion points that affected the growth between stages 7 and 8 (163 and 164 bpm) and between stages 9 and 10 (170 and 170 bpm), respectively. This observation was already demonstrated by Conconni (Hnizdil et al., 2019; López Chicharro & Mojares, 2008; Sergueyevich & Dmitriyevich, 2005) with the metabolic transition point or transition threshold.
Gas analysis demonstrated the participant’s low physical condition at the moment of executing his maximum aerobic power to 34.38 ml/kg/min at the end of the test. Figure 1 shows how the CO2 presented a similar behavior going from 2.8 ml/kg/min at rest to 31.7 ml/kg/min at the end of the activity. It is also shown how the RQ, described as the relationship between carbon dioxide eliminated and oxygen consumed, approximates to 1 when there is an increase in the exercise while it reaches 0.80 at rest (Subiela, 2005).
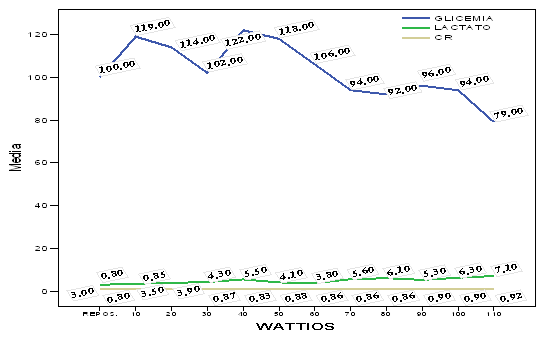
Figure 2
Representative curves of the glycemia (mg/dl), the lactate (mmol/lt), and the RQ during the incremental test with Cycle Ergometer
Subject 2
The values of the biochemical and physiological variables of the incremental test with the treadmill are shown in Figure 3. It is observed how the lactate values, HR, and VO2 increased significantly when going from rest to the first load. The same way, the HR and the lactate increased until the lactate reached 8.6 mmol/lt during the last stage of the exercise.
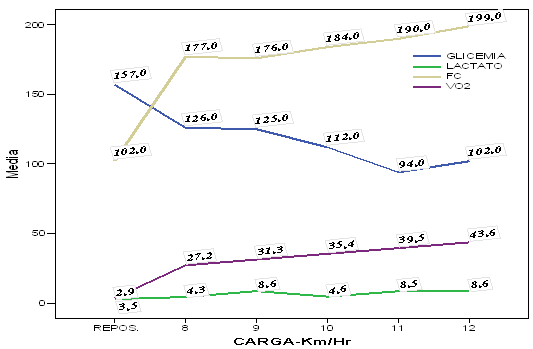
Figure 3
Representative curves of the Glycemia (mg/dl), the Lactate (mmol/lt), HR (beat/min), and VO2 (ml/kg/min) during the incremental test with the treadmill.
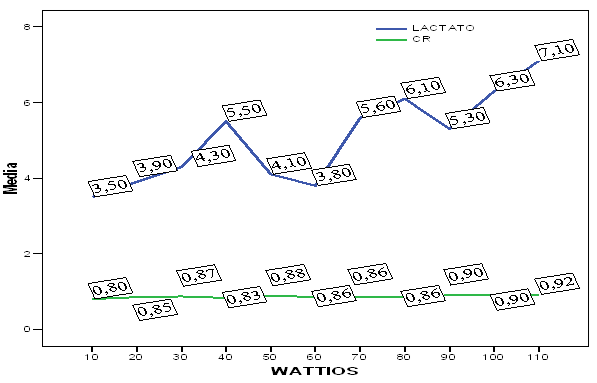
Figure 4
Representative curves of the lactate (mmol/lt) and the respiratory quotient during the incremental test in the Cycle Ergometer.
The scatter plots that could show a direct or indirect tendency are appreciated in Figure 5.
High correlations between the Glycemia level-VO2 (Fig.5.1) and Glycemia level-CO2 (Fig.5.3), Pearson of r:-0.853 and -0.851, respectively, according to the magnitude of correlation coefficient scales of measure presented by Ruiz (quoted by Jiménez & Silva, 2007), are shown in Table 2. Moreover, correlations between Lactate-VO2 (fig.5.2) and Lactate-CO2 variables (fig. 5.4), with a Pearson correlation coefficient of r: 0.821 and -0.810, respectively, were also considered very high.
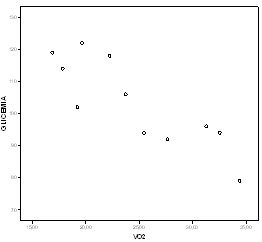
Figure 5.1
Dispersion of glycemia in relation to VO2 during the incremental test with a Cycle Ergometer
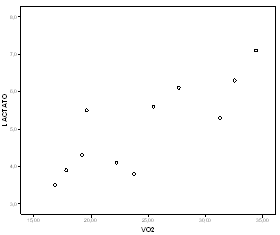
Figure 5.2
Dispersion of lactate in relation to VO2 during the incremental test with a Cycle Ergometer
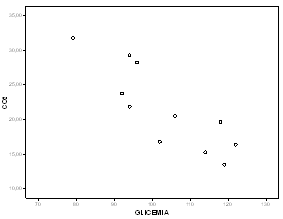
Figure 5.3
Dispersion of CO2 in relation to Glycemia during the incremental test with a Cycle Ergometer
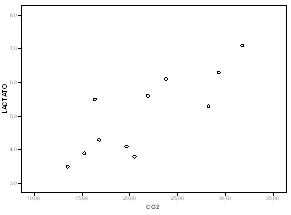
Figure 5.4
Dispersion of Lactate in relation to CO2 during the incremental test with a Cycle Ergometer
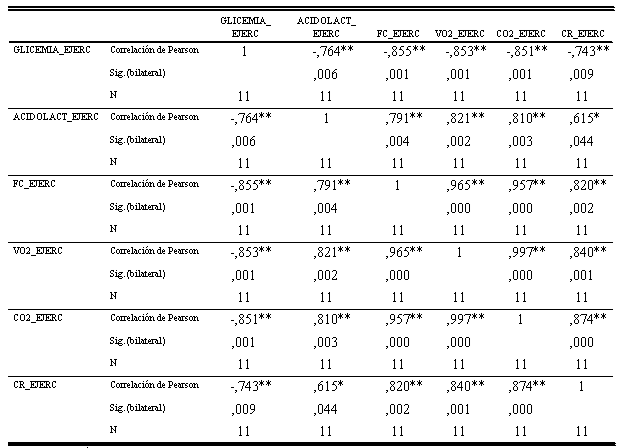
Correlation is significant at level 0.01 (bilateral) * Correlation is significant at level 0.05 (bilateral)
Discussion
Whenever the exercise intensity increases, the VO2 grows linearly until it reaches the plateau, representing the maximum oxygen uptake peak. During the incremental exercise, subject 1’s VO2 level was observed in the last stage of the test with a load of 110 W and a VO2 of 34.38 ml/kg/min. Also, whenever the oxygen demand increases, there is a growth of CO2, which must be removed in order to avoid acidity that might interrupt the exercise.
Nevertheless, in the classic theory, when the exercise intensity increases, lactate concentration increases from approximately 50% to 60% of VO2 in untrained subjects. Therefore, if the exercise intensity increases, the lactate also increments; but if the exercise intensity is stable, the lactate reaches a high level in relation to the one at rest, but it stabilizes. This reflects that the production and removal rates have reached similar values (Mazza, 1997). According to Mazza, radioisotope methodologies have demonstrated that the lactate removal rate depends on its blood concentration, which means that when blood lactate increases, the removal mechanisms are stimulated.
There is a quasi-linear direct relationship between the lactate removal intensity and the aerobic intensity shown as VO2 (r: 0.86). It is currently known that the metabolic transition is an individual factor. The same individual situation occurs with the role change given to the lactate as a buffer mechanism contrary to the historical affirmation that it is an acidifying substance (Mata et al., 2012; Robergs et al., 2004).
Many research studies have analyzed the metabolic transition point in order to explain its mechanisms and characteristics, considering that this maximum stable point or starting point, from which an increase of the load corresponds to an abrupt rise in lactate production during the exercise, is a different factor for every individual (Alba, 2005; Sergueyevich & Dmitriyevich, 2005).
It is also demonstrated that the high concentration values of lactate are related to the ones of CO2, pointing out that the CO2 and VO2 increase linearly during low-intense exercises (under the ventilator threshold). Alba supports this proposal based on Beaver’s methodology, which consists in observing both gases’ behavior simultaneously (Alba, 2005). Nevertheless, when the intensity of the exercise increases (over the anaerobic threshold), the slope increases in both gases but in a higher portion in the CO2. This is due to the gas added from the new source of CO2, which represents the lactate-bicarbonate of soda in the bloodstream. This fact is well-known in specialized literature as the non-metabolic CO2.
It is also acceptable to observe an increased respiratory quotient, as shown in Figure 4. This value approximates to 1.0 when the workload increases, which explains the participation and demonstration that the exercise was done as an anaerobic process.
Similarly, but inversely, a high correlation (r= -0.85) between glycemia and the VO2 is observed in Figures 2 and 3. This correlation is coherent with the energy expenditure required by the test because while the oxygen uptake increases, the subject needs more glucose to preserve the production rate of ATP. In fact, many authors advise that the hepatic glycogen supplies are limited, and the liver cannot immediately produce glucose from other substrates (Viru & Viru, 2001; Wilmore & Costil, 2007). Therefore, the blood glucose levels could be reduced when the energy expenditure exceeds the hepatic glucose production.
The science of exercise clarifies and explains new criteria and paradigms every day in order to offer an updated analysis of multiple phenomena that occur during the exercise. First, the control of HR Kinetics has been widely used during incremental exercise tests due to its high correlation with the oxygen demand and uptake at the tissue level, especially to find inflexion points and stages associated with energetic metabolism changes. In a study conducted in Mexico with athletes and untrained subjects, some studies used non-invasive methods and computerized linear regression analysis of the HR answer phases. The results showed that the HR kinetics was greater in adults with training adaptation compared to untrained adults (Hnizdil et al., 2019; Perez et al., 1999).
Nowadays, it is known that during low and high workloads, the glucose degradation mechanisms (glycolysis) keep constantly activated, generating hydrogen ions flows towards the cell sap and, therefore, participating in acid-base balance conditions of the environment. Besides this, other parallel mechanisms, such as ATP hydrolysis or creatine phosphate (PCr) degradation, have the same behavior in the same direction. At that time, Robergs clarified the important role of the protons derivate from glycolysis and the ATP hydrolysis in metabolic acidosis, especially during constant and high-intensity exercises (Robergs et al., 2004).
Heredia et al. (2014) also intend to clarify the causes of acidosis that, during the last century and even today, are charged to lactate acid formation. Today, it is known that it is not possible to understand an acid formation with a very low dissociation fixed value (pk 3.86) in human muscles. Current scientific explanations affirm that the resulting substance is, in reality, a salt known as lactate and whose functions are as a buffer since it obtains hydrogens from the pyruvate at the end of the cytosolic glycolysis (Lopes-Silva et al., 2019; Robergs et al., 2004).
This study has considered the interpretation compliant with the description of updated concepts of biochemical responses to exercise. Thus, the hematological biomarkers control such as lactate is taken into consideration in previous controls and during incremental test protocol applied to both individuals, with a value of 3.5 mmol/lt in rest in both subjects; the values at the end of the exercise were 7.10 and 8.6 mmol/lt in subjects 1 and 2, respectively.
The difference between the lactate final values of 7.10 mm/lt with the cycle ergometer and a greater production rate of 8.6 mmol/lt with the treadmill could be explained by the different physical conditions of both subjects from a maximum anaerobic exertion established by the VO2 of 34.4 ml/Kg/min of subject 1, in contrast with 43.6 ml/Kg/min of subject 2.
Regarding the use of protocols, researchers from the 1950s and 1960s in the sports field, such as Von Dobeln, Astrand, Margaria, or Stalin, stated that there is a higher VO2 when physical activity is measured with a treadmill compared to the results of measurement with a bicycle (Bassett & Howley, 1997; Bosquet et al., 2002; Quintero et al., 2019). Many authors highlight the fact that the lactate value of 4.0 mmol/lt with a greater VO2 is reached when the test is done on a treadmill instead of in a cycle ergometer (Gaul et al., 1995; Milioni et al., 2017; Rodriguez et al., 2019). This conclusion coincides with the results of this study; thus, the values are 19.2 and 27.2 ml/kg/min for the cycle ergometer compared to the treadmill exercise, respectively. This difference is due to the inclusion of a greater muscle mass by exercising with the Treadmill.
Concerning the lactate behavior, the increase in lactate level is understood as a metabolic agent produced by the cell’s capacity to neutralize the ions of hydrogen liberation. These ions are produced during glycolysis and, therefore, once the lactate accepts them, they gain buffer functions to avoid acidification. In this sense, this study coincides with Heredia’s interpretations when they clarify the real causes and consequences of formed lactate in rest as well during exercise (Mata et al., 2012; Roig, 2002).
On the other hand, besides the lactate formation during the glycolysis processes, this study observes the possibilities of lactate metabolic continuity, known as the removal or clearance of lactate in the scientific literature (Gharbi et al., 2008; López & Campos, 2017). Regarding the most common removal options of lactate mentioned in the literature, it was said that the lactate exits the myocyte and then oxidizes in high-density mitochondrial cells or reacts as circulating bicarbonate in the plasma to form what is called the non-metabolic CO2 (López & Campos, 2017; McArdle e al., 2015)
Nowadays, we could continue the debate by adding information given by molecular biology about the molecular conditions which could appear in Slow-Twitch fibers or oxidizing fibers to reconvert the lactate into pyruvate. This could happen only if in this type of fibers appears the conditioning enzymatic complex lactate dehydrogenase in its isoform of LDH-H with a capacity to make the lactate formation reversible beyond the LDH-M form (Roig, 2002).
Conclusion
The HR indicators during the test support a substantial increase in proportion to the workload increase. A similar behavior is observed in the VO2, which goes from 3.5 ml/kg/min at rest to 34.38 ml/kg/min at stage 11 of the test. The RQ approximates to 1 when the workload is higher. During the incremental protocol with the cycle ergometer, the VO2 and the lactate present a high linear-direct correlation, and the lactate and CO2 show similar behavior. The glycemia and the VO2, as well as the glycemia and CO2, show a very high inverse-linear correlation. It is concluded that this type of protocol is safe for the group under study, and the validity of the results is in accordance with theoretical expectations.
Recommendations
To accurately predict the anaerobic threshold of every subject, it is recommended that the VO2 of each of them be tested previously. The usage of corresponding formulas compliant with the population’s characteristics is also recommended in order to predict the maximum Heart Rate as a possible indicator of the exercise intensity, as well as the increase in the number of individuals in order to generalize the results. A final recommendation is the application of the same protocol to female subjects in order to establish the possible differences in physiological and biochemical indicators compared to male individuals.
Conflicts of Interest Statement
The authors of this article are responsible for all aspects of the submitted paper and guarantee its accuracy. All authors contributed to the conceptualization, formal analysis, research, methodology, resources, supervision, writing the original manuscript, proofreading, and editing. The research group declares not having any conflicts during the development of this study.
References
Alba, A. (2005). Test funcionales: cineantropometría y prescripción del entrenamiento en el deporte y la actividad física. Armenia: Kinesis.
Bassett, D. R., & Howley, E. T. (1997). Maximal oxygen uptake: “classical” versus “contemporary” viewpoints. Medicine and Science in Sports and Exercise. 29(5), 591-603. https://doi.org/10.1097/00005768-199705000-00002
Bosquet, L., Léger, L., & Legros, P. (2002). Methods to determine aerobic endurance. Sports Medicine, 32, 675-700. https://doi.org/10.2165/00007256-200232110-00002
Gaul, C. A., Docherty, D., & Cicchini, R. (1995). Differences in anaerobic performance between boys and men. International Journal of Sports Medicine, 16(7), 451-455 https://doi.org/10.1055/s-2007-973036
Gharbi, A., Chamari, K., Kallel, A., Ahmaidi, S., Tabka, Z., & Abdelkarim, Z. (2008). Lactate kinetics after intermittent and continuous exercise training. Journal of Sports Science and Medicine, 7(2), 279–285. https://www.ncbi.nlm.nih.gov/pmc/articles/PMC3761459/
Hnizdil, J., Skopek, M., Nosek, M., Louka, O., Musalek, M., & Heller, J. (2019). The Conconi Test - Searching for the deflection point. Physical Activity Review, 7, 160–167. https://doi.org/10.16926/par.2019.07.19
Jiménez, R. y Silva, C. (2007). Procesamiento estadístico de datos con SPSS. Barquisimeto – Venezuela: Instituto Pedagógico de Barquisimeto – UPEL.
Katch, V. L., McArdle, W. D., & Katch, F. I. (2015). Fisiología del Ejercicio Fundamentos.Editorial Panamericana.
Lopes-Silva, J. P., Reale, R., & Franchini, E. (2019). Acute and chronic effect of sodium bicarbonate ingestion on Wingate test performance: a systematic review and meta-analysis. Journal of Sports Sciences, 37(7), 762-771. https://doi.org/10.1080/02640414.2018.1524739
López Chicharro, J., & Mojares, L. (2008). Fisiologia clinica del ejercicio. Editorial Panamericana.
López-Chicharro, J., & Lucía-Mulas, A. (1996). Fundamentos de fisiología del ejercicio. Ediciones pedagógicas.
López, J., & Campos, D. (2017). Umbral Láctico: Bases Fisiológicas Y Aplicación Al Entrenamiento. Editorial Panamericana.
Mahler, D. A., Froelicher, V. F., Houston, N., & York, T. D. (2005). Manual ACSM para la valoración y prescripción del ejercicio (2da ed.). Barcelona: Paidotribo.
Mata, F., Heredia, J., Peña, G., Sánchez, L., Roig, J., & Grigoletto, E. (2014). Ácido Láctico: ¿el “enemigo” incomprendido y/o inexistente? G-SE. https://g-se.com/acido-lactico-el-enemigo-incomprendido-y-o-inexistente-bp-s57cfb26d8e350
Mazza, J. (1997). Ácido Láctico y Ejercicio (Parte I ). Actualización en Ciencia del Deporte, 5(14), 1–13. https://g-se.com/cido-lactico-y-ejercicio-parte-i-130-sa-p57cfb27106bd2
McArdle, W. D., Katch, F. I., & Katch, V. L. (2015). Exercise physiology: Nutrition, energy and human performance. Lippincott Williams & Wilkins.
Milioni, F., Zagatto, A. M., Barbieri, R. A., Andrade, V. L., Dos Santos, J. W., Gobatto, C. A., da Silva, A., Santiago, P., & Papoti, M. (2017). Energy systems contribution in the running-based anaerobic sprint test. International Journal of Sports Medicine, 38(3), 226–232. https://doi.org/10.1055/s-0042-117722
Perez, J. P., Mendoza, J. L., Salinas, G. O., Chavarria, L. D., & Caleti, J. I. L. (1999). Cinetica del intercambio gaseoso y la frecuencia cardiaca durante una prueba de esfuerzo creciente en atletas mexicanos. Revista del Instituto Nacional de Enfermedades Respiratorias. 12(2), 87-96.
Quintero, A. M., Orssatto, L. B., Pulgarín, R. D., & Follmer, B. (2019). Physical performance, body composition and somatotype in Colombian judo athletes. Ido Movement for Culture. Journal of Martial Arts Anthropology, 19(2), 56–63. https://doi.org/10.14589/ido.19.2.8
Robergs, R. A., Ghiasvand, F., & Parker, D. (2004). Biochemistry of exercise-induced metabolic acidosis. American Journal of Physiology - Regulatory Integrative and Comparative Physiology. https://doi.org/10.1152/ajpregu.00114.2004
Robergs, R. A., McNulty, C. R., Minett, G. M., Holland, J., & Trajano, G. (2018). Lactate, not Lactic Acid, is Produced by Cellular Cytosolic Energy Catabolism. Physiology, 33(1), 10–12. https://doi.org/10.1152/physiol.00033.2017
Rodriguez, E., Romero, Ó., Merino, R., & Cañas, A. (2019). Anaerobic threshold. Conceptual problems and practical applications in endurance sports. Retos, 36, 401–408.
Roig, J. (2002). Metabolismo Energético (Mioenergía): Un análisis de los Errores de Interpretación. PubliCE. https://g-se.com/metabolismo-energetico-mioenergia-un-analisis-de-los-errores-de-interpretacion-136-sa-H57cfb27107b3e
Sergueyevich, V., & Dmitriyevich, V. (2005). Fisiología del Deportista. Paidotribo.
Subiela, J. (2007). Aspectos fundamentales del umbral anaeróbico. Vitae: Academia Biomédica Digital, (30). https://vitae.ucv.ve/pdfs/VITAE_378.pdf
Subiela, J.V. (2005). Introducción a la Fisiología Humana Énfasis en la Fisiología del Ejercicio. Barquisimeto: Fundaupel - IPB.
Viru, A., & Viru, M. (2001). Análisis y control del rendimiento deportivo. Paidotribo.
Wilmore, J., & Costil, D. (2007). Fisiologia del esfuerzo y del deporte. Paidotribo.