
Revista de Política Económica y Desarrollo Sostenible
EISSN: 2215-4167 • Vol. 3 (1) • Enero- Junio, 2018: 20-43
DOI: http://dx.doi.org/10.15359/peds.3-1.2
URL: http://www.revistas.una.ac.cr/politicaeconomica
Revista electrónica semestral publicada por el Centro Internacional de Política Económica para el Desarrollo Sostenible
Universidad Nacional, Lagunilla, Heredia Apartado 2393-3000
Mapping Environmental and Socioeconomic impacts of hydrometeorological hazards across Central America. Study case: Honduras
Mapeo de los impactos ambientales y socioeconómicos de las amenazas hidrometeorológicas en América Central. Estudio de caso: Honduras
Eric.J. Alfaro123, ORCID: http://orcid.org/0000-0001- 9278-5017
Hugo G. Hidalgo12, ORCID: https://orcid.org/0000-0003- 4638-0742
Paula M. Pérez-Briceño14, ORCID: https://orcid.org/0000-0002- 7217-8495
Correo de correspondencia: paula.perez@ucr.ac.cr
Fecha de recibido: 19 de setiembre del 2017- Fecha de corrección: 11 de diciembre del 2017 - Fecha de aceptación: 16 de Enero del 2018
Abstract
Hydrometeorological hazards have historically affected Central America and significantly impacted the isthmus. However, the spatial distribution of those impacts is heterogeneous and depends on several factors, such as storm trajectories and community vulnerability. To address the spatial distribution of impacts related with historical events, Honduras was used as a case study. This paper was aimed at identifying the municipalities most impacted by the hydrometeorological events and at studying their correlation with socioeconomic variables. Impacts recorded from 1919 to 2012 were collected from the DesInventar and EM-DAT databases. Data was georeferenced using a Geographical Information System and the information was disaggregated at local government scale. Spearman spatial correlation were calculated between physical variables and socioeconomic indices. The municipalities that reported more impacts included La Ceiba, Choluteca, Francisco Morazán and Yoro. Three hazards were found and the most important regarding impacts: cold fronts or outbreaks, tropical cyclones and easterly waves. The first type was more common during boreal winter, while the last two hazards were normally found during boreal spring-summer-autumn. Population and poverty were the social variables with the highest correlation with impacts. The analysis showed that spatial distribution of impacts related with hydrometeorological causes cannot be explained solely by climate causes. Therefore, other variables, such as socioeconomic should also be considered in analyses of these types of impact.
Keywords: Climate, impacts, hydrometeorology, Honduras, Central America.
Resumen
Las amenazas hidrometeorológicas han afectado históricamente América Central y generado muchos impactos en el istmo. Sin embargo, la distribución especial de estos impactos es heterogénea y depende de varios factores, tales como la trayectoria de las tormentas y la vulnerabilidad de la comunidad. Para analizar la distribución de los impactos relacionados con eventos históricos, se usó Honduras como un estudio de caso. El objetivo de este estudio fue identificar las municipalidades más impactadas por eventos hidrometeorológicos y estudiar sus correlaciones con variables socioeconómicas. Se recolectaron los impactos del periodo 1919-2012 de las bases de datos DesInventar y EMDAT. Los datos fueron georeferenciados usando un Sistema de Información Geográfica y la información fue desagregada a una escala de gobierno local. Se calcularon las correlaciones espaciales de Spearman entre las variables físicas y los índices socioeconómicos. Las municipalidades que reportaron mayores impactos incluyen a La Ceiba, Choluteca, Francisco Morazán y Yoró. Se encontró que tres amenazas fueron las más importantes en asociación con los impactos: frentes o empujes fríos, ciclones tropicales y ondas del este o tropicales. La ocurrencia de los primeros fue más común durante el invierno boreal, mientras que la de los otros dos fue normalmente durante la primavera, verano y otoño boreal. La población y la pobreza fueron las variables sociales más correlacionadas con los impactos. El análisis mostró que la distribución especial de los impactos relacionados con causas hidrometeorológicas no puede ser explicada por variables climáticas. Por lo tanto, otras variables, como las de tipo socioeconómico, deben de ser consideradas en el análisis de este tipo de impactos.
Palabras clave: Clima, impactos, hidrometeorología, Honduras, América Central.
Introduction
Present and future socioeconomic vulnerabilities as defined in Wilches-Chaux (1993); Cardona et al (2012); Koks, Jongman, Husby y Botzen (2015); Mechler and Bouwer (2014); Jongman et al (2015); are factors that can exacerbate the impacts of climate variability and change (Hidalgo and Alfaro, 2012; Muñoz et al, 2012). Ferreira, Hamilton, and Vincent (2011) present several examples of countries or regions around the world where present and future vulnerabilities have exacerbated the impacts of climate variability. Central America is an economically challenged region that is also affected by a large hydrological variability (Muñoz et al, 2012), which results from the influence of several large-scale climatic processes and features (Alfaro and Pérez-Briceño, 2014). Those climatic processes include the subtropical high of the North Atlantic (Hidalgo, Alfaro, and Quesada-Montano, 2017; Taylor and Alfaro, 2005), which is associated with the strength of the easterly trade winds. Other large-scale processes that affect climate in the region at interannual time scales are El Niño-Southern Oscillation (ENSO), Caribbean and Atlantic climatic processes such as the Caribbean Low-Level Jet (CLLJ) (Amador, 2008) or Tropical North Atlantic climatic variations (TNA) (Enfield, Mestas, Mayer and Cid-Serrano, 1999), the location of the Inter-tropical Convergence Zone (ITCZ), and other features such as the Mid-Summer Drought (MSD) (Magaña, Amador and Medina, 1999a). Amador, Alfaro, Lizano and Magaña (2006) present a more detailed review of the main controls that affect the climate in Central America. These processes modulate the occurrences of different hazards in Central America.
A central issue with prediction and mitigation of the impacts associated with climate variability and climate change is the difficulty of quantify the risk across different sectors. The risk is composed of exposure to hazard and vulnerability. While exposure to hazard is estimated with greater precision, it is more difficult to know the risk without an adequate and objective way to establish the degree of spatial and temporal vulnerability of people to hazards. Although there have been efforts in this direction, particularly in food security, the available reports are scattered, have different spatial scales and are not available in a manner that helps studies on climate risk.
Traditional studies conducted to date (i.e. Retana, 2012) are based on the physical parts of the hazard, focusing on the exposure of extreme event defined by periods when the hydrometeorological variable exceeds a fixed threshold, leaving out the social component of risk. However, the quantifying impacts requires more information than just what is obtained from the natural perspective and information on population emplacement and their socio economic characteristics also need to be taken into account. In a recent study, Pérez-Briceño, Alfaro, Hidalgo and Jiménez (2016) showed the same relationships between impacts and socio economic variables for six countries of Central America: Guatemala, Honduras, El Salvador, Nicaragua, Costa Rica and Panama. They state that municipalities with the greatest populations of each country, like the ones containing the capital cities: Ciudad de Guatemala (Guatemala), Distrito Central (Honduras), San Salvador (El Salvador), Managua (Nicaragua), San Jose (Costa Rica), Ciudad de Panama (Panama) have high correlation with impact occurrences. They showed also that in this type of analysis, needs to consider socioeconomic variables like poverty, health and Human Development Index, in order to infer robust conclusions about impact causes (Muñoz et al, 2012; Neri and Magaña, 2016).
Risk is defined as the probability of a damaging event that causes losses and harm, of different types such as social, economic or environmental, having different degrees and affecting several sectors. We understand risk as the intersection of three elements: hazard, exposure and vulnerability (Kron, 2005; Intergovernmental Panel on Climate Change [IPCC], 2012 and 2014; Neri and Magaña, 2016; United Nation Office for Disaster Risk Reduction [UNISDR], 2015). Impact is a pre-existing risk condition that was not timely risk-reduced, and as the effect of a disaster or its direct/indirect consequences (Narváez, Lavell and Pérez, 2009). On the other hand, hazard is the probability of occurrence of a physical event that can cause any type of damage to society (Neri and Magaña, 2016).
In this paper, the impacts generated by hydrometeorological hazards are quantified and spatially defined at a local governmental scale and are associated with socioeconomic conditions, using Honduras as a case study. The regional work of Pérez-Briceño et al. (2016) gives a broad perspective of the region. Honduras is a very much exposed to a hydrometeorological hazards because of its geographical position as well as having low development rank (129th position according to its Human Development Index in 2014) that was affected by hurricane Mitch in 1998, causing long term effects in the region’s economy. Moreover, the resilience (Hidalgo and Alfaro, 2012) of a region that has been hit by an event such as a hurricane can be even lower for many years after the event. However, Honduras has been affected by several other hydrometeorological events. This is the case because a mountain chain crosses the country from Northwest to Southeast approximately (covering about 63% of its territory), causing two slopes, Caribbean and Pacific, generating a marked climate variability associated to this complex topography (Figure A1 and Westerberg et al, 2010). During the boreal winter, most of the country’s precipitation is observed at the Caribbean slope, related to forced mechanic elevation of humid, warm trade winds and the pass of cold outbreaks from November to April. From May to October, precipitation increases in the Pacific slope, dominated mainly by the formation of mesoscale systems (Alfaro and Pérez-Briceño, 2014; Instituto Hondureño de Ciencias de la Tierra [IHCIT], 2012; Taylor and Alfaro, 2005). Annual precipitation accumulation is greater near the two coasts, with more than 2000 mm, while 1500 mm of precipitation is normally observed in the interior. Average temperatures range from 31°C near the coasts to about 18°C in the hills. In general, the Caribbean slope shows higher relative humidity and lower net radiation than the Pacific slope (IHCIT, 2012). Rainy season tends to start by late May and finish by the end of October and the annual cycle is mainly bimodal. The first peak is observed in June and the second one, greater than the first one, in September. These two peaks are separated by a reduction of rains knows as MSD (Magaña et al, 1999a). Therefore, the MSD is characterized by a relative minimum normally observed from middle July to middle August (Taylor and Alfaro, 2005). Winter cold fronts or cold outbreaks, Atlantic basin tropical cyclones and easterly waves are among the main hydrometeorological hazards that impact Honduras (Alfaro and Quesada, 2010; IHCIT, 2012; Zárate-Hernández, 2013). These two last hazards are more common during boreal summer and autumn.
Our goal in this work is to identify the municipalities that are more impacted by hydrometeorological events and study their correlations with socioeconomic variables. This is important because the frequency of these occurrences can increase in the future according to the IPCC, as a result of Climate Change (IPCC, 2012; 2014). In addition, there were no previous study regarding the spatial distribution of impacts associated with hydrometeorological events in Central America, focusing in Honduras; therefore, this study can provide a relationship between that impacts spatial distribution and the distribution of the social indices, at municipal scale. In addition, the study provides valuable information for disaster prevention and climate change planning. As in the case of he short and medium range forecast, the information about Climate Change projections can be used in conjunction with the impact maps to plan for infrastructure improvements, as well as emergency preparedness and management programs, including strategies for mitigation and adaptation.
Identifying the climatic processes that produce more impacts and finding which local governments are more impacted by them, help to plan and allocate human and economic resources to prevent disasters, identifying the impacts spatial distribution associated with the hydrometeorological hazards, and link them with different climatic processes (Muñoz et al, 2012). For example, when the NOAA National Hurricane Center provide the trajectory forecast for a cyclone in the Caribbean basin, the Honduras institution that deals with emergency attention can identify if this system can affect Honduras and which are the expected local governments that can be impacted. These municipalities can be attended with some time in advance.
1. Data and Methods
Records of impacts from two databases from 1919 to 2012 were used in the analysis. Those databases include DesInventar (Velásquez and Rosales, 1999; data available at http://www.desinventar.org/es/) an instrument that stores homogeneously material on all types of disasters, including volcanic, hydrometeorological, seismic, biological, anthropogenic and chemical; accompanied by a query module, geographical representation, statistical analysis and graphing of variables available in a database (Velásquez and Rosales, 1999) and Emergency Events Database (EMDAT; data available at http://www.emdat.be/ ), a systematic database on impacts of disasters on vulnerable populations that provides valuable information to governments and agencies in charge of relief and recovery activities (CRED, 2009). The first database includes also press bulletins. This is important to know because the report of impacts depends on technology on the time of the event and also on the access to some places. These databases do not include details of the intensity of the events reported, only on occurrences and types of damages caused.
DesInventar is a regional disaster database with systematic information about daily disasters of small and medium impact. It was developed by Red de Estudios Sociales en Prevención de Desastres en América Latina (La RED) based on pre-existing data, such as newspaper sources and institutional reports in nine countries in Latin America. Desinventar, which was developed to enable the visualization of disasters from a location scale (town or equivalent) facilitates the dialogue between institutions, sectors, provincial and national governments regarding risk management (Velásquez and Rosales, 1999; DesInventar, 2013).
EMDAT provides an objective basis for vulnerability assessment and rational decision-making in disaster situations. This database is a systematic collection that also provides analysis regarding the impacts of disasters on vulnerable population. These data provide valuable information to governments and agencies in charge of relief and recovery activities. The Center for Research on the Epidemiology of Disasters (CRED), maintains EMDAT database and has a long history of standardized data compilation, validation and analysis. It provides data on the human impact of disasters, such as the number of people killed, injured or affected, disaster-related economic damage estimates and disaster-specific international aid contributions (CRED, 2009). We also collected press reports for August 2010 from Honduran media, to show their use in complementing the information, based on DesInventar and EMDAT databases.
Each record available for each database includes: initial and final date of the event country, department, local government (known locally as municipality), type of specific event (i.e. rain, storm, strong wind, low temperatures, drought, thunderstorms); cause or hazards associated when is available (i.e. tropical storm, easterly wave, cold front, El Niño-Southern Oscillation or ENSO phases); type of general event (i.e. low pressure system, tropical depression, tropical storm, tropical cyclone, cold outbreaks), name of tropical cyclones with at least the category of tropical storm; list of impacts (i.e. other damages associated with floods, other damages associated with landslides, problems for sailing and flying transportation, fallen trees, wounded or sick people, damages to road infrastructure, damages in housing, damages to agricultural and livestock sector, damages to sewerage, damages to electric system, damages to water system and others damages with low frequency of occurrence individually). Reports on the source and event ID are also included in the unified database. Total entries used were 24394 corresponding to 3632 events.
The occurrence of hydrometeorological hazards with geological (e.g. igneous, sedimentary, metamorphic rocks), topography (e.g. slope) and geomorphology (landforms, drainage patterns and dynamics) variables is out of the scope of this work, but part of this information can found in IHCIT (2012).
Reports from both databases were cross checked to avoid double counting of events. Impacts related to hydrometeorological events were indicated using a system of presence (1) or absence (0), and were later homogenized to integrate records of both databases, then classified according to impact type and grouped by local government, creating a new unified database for mapping the results in a Geographic Information System (GIS) software.
GIS enables us to systematize data at a municipality level in terms of the spatial scale, represent the value of the (sum of) impacts to be correlated with socioeconomic indexes, map it with a chart map of real magnitudes and analyze it according to its geographical distribution.
The non-parametric Spearman correlation coefficient to test the association between the value of the impacts and socio economic indices, i.e. Human Development Index (HDI), poverty, extreme poverty, education level, Gini Coefficient and population size, all collected at the local government scale as the hydrometeorological impacts (Flores et al, 2009 and IHMC, n.d.).Socio economic indices are described in Appendix B.
2. Results
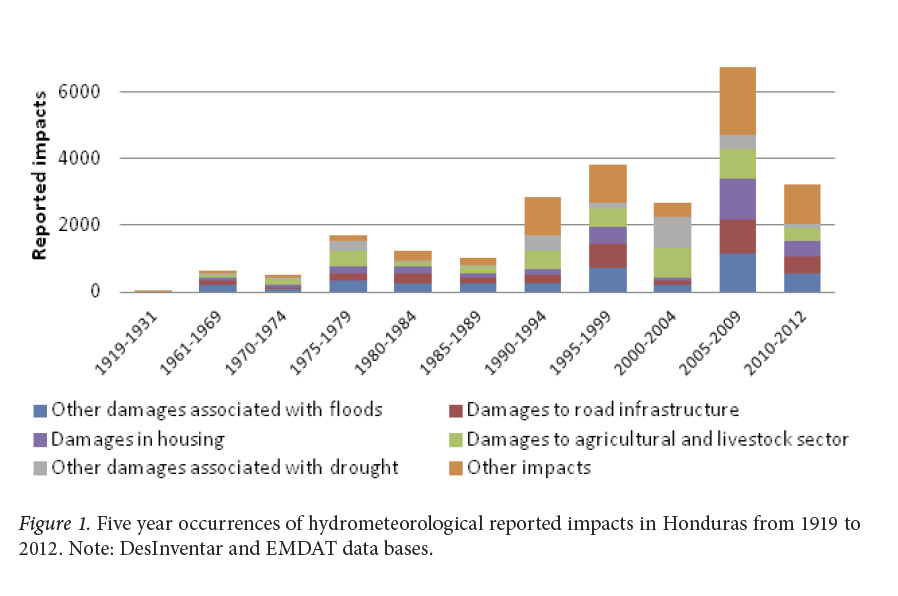
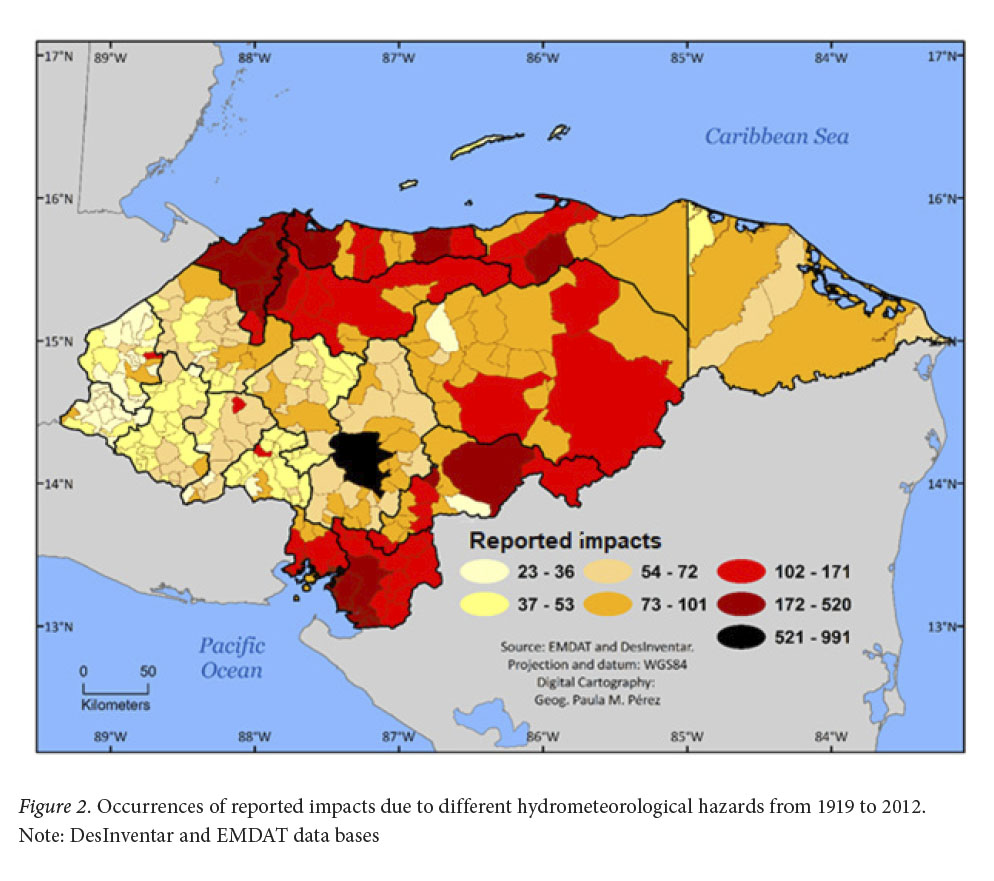
The annual occurrences of impacts linked to hydrometeorological hazards shows that the years with the highest frequency of reported impacts were 2005- 2009 (Figure 1). The occurrence of impacts from 1919 to 2012 was more frequent in the northern, central and southern of the country (Figure 2). Results show that units reporting more impacts are Distrito Central in Francisco Morazán Department and San Pedro Sula in Cortés the Department, wich are the political and financial capitals, respectively. These also correspond to the more populated cities according to IHMC (n.d.) (see Figure. 3). Most of the impacts listed correspond to nonspecific damages associated with floods, specific damages to road infraestructure and specific damages in housing. Note that although flooding can cause damages to infrastructure and housing, the database does not duplicate counting in those cases. The apparent trend in the impacts shown in Figure 1 could respond to a mix of different sources like social vulnerability increases, related to population growth and technological advances. For example in the past (around 1950’s), places far from the main city could not had reported impacts by the absence of a source of communication, now days cell phones, internet, social networks and phone emergency numbers like 9-1-1, allow prompt disaster reporting.
The seasonal distribution of the hydrometeorological hazards is presented in Figure 3. Most of the impacts were concentrated in May and October (also in Pérez-Briceño et al, 2016). Conversely, most of the impacts that occurred from December to April were associated with cold fronts (also known as cold outbreaks), while those from May to November were related to tropical cyclones and easterly waves (North-South oriented low pressure regions, moving westerly across the tropical Atlantic and the Caribbean, with atmospheric instability and thunderstorms associated (Alfaro and Pérez-Briceño, 2014; Serra et al, 2010).
There was a strong association between values of impacts and socio economic indixes, including population size, poverty, extreme poverty, HDI, Gini coefficient, and Educational Level (Spearman correlation coefficients: 0.49, 0.48, 0.46, 0.45, 0.38, and 0.37, respectively, p<0.01). Those indixes have significant correlations among them, but different social indixes are related with different social aspects and dimensions (Muñoz et al, 2012). The strongest correlation found was total population size since the higher the population size, the higher population exposition to the different hazards. Correlations between values of impacts and male and female populations are very similar to total population (Spearman correlation coefficients: 0.46 and 0.48, respectively, p<0.01). Correlations between occurrences of impacts and poverty and extreme poverty are the second and third highest, respectively. Notice that areas with higher HDI and Educational Level, usually in urban centers, are also areas with more population extreme poverty, in other words, those are regions with higher social disparities. This could explain the positive correlations found between the impacts and the Gini coefficient. According to IHCIT (2012), all the first ten local governments (Figure A2; Appendix C) with more impacts listed, show high vulnerability (Wilches-Chaux, 1993; Muñoz et al, 2012). As an example of our methodology, when damages associated with floods are correlated separately, the highest correlations are with Poverty and total Population (Spearman correlation coefficients: 0.54 and 0.53, respectively, p<0.01). With droughts, the corresponding correlations are 0.05 (non-significant) and 0.55 (p<0.01).
3. Discussion and Conclusions
Results (Figure 1) support the findings of other studies documenting a record-breaking Atlantic hurricane season in 2005, which caused devastating losses across the region from July to November (Grover-Kopec, 2006). In that year, most damage in the Caribbean and Central America came from Hurricanes Dennis, Emily, Stan and Beta, and Tropical Storm Gamma, and Honduras one of the most affected countries, along with Guatemala and Nicaragua. According to Amador, Alfaro, Hidalgo and Calderón (2011), 2010 was very active for tropical storms in the Caribbean basin. By July 2010, La Niña had developed and winds associated with the CLLJ were much weaker than normal, an attribute of ENSO cold events in the region and a condition favorable for tropical cyclone development, in addition, persistent warm Sea Surface Temperature (SST) anomalies observed in the Caribbean and the tropical North Atlantic. In this particular year, there were 13 storms in the Caribbean, seven hurricanes, three of wich were major hurricanes (greater than category 3). In this same year, five additional tropical cyclones reached positions close to the Caribbean Central American coast. Important impacts were related to Tropical Cyclone Nicole and Hurricane Thomas (see Amador, 2011). Cold outbreaks above the average during 2005-2006, 2007-2008, 2008-2009, 2009-2010 and 2010-2011 were also reported (Zárate-Hernández, 2013). The year 2008 was very active for tropical storms (Amador, Alfaro, Rivera and Calderón, 2009). Out of the 16 storms observed in the Atlantic 10 entered the Caribbean basin, four of which were very strong, causing significant economic and social damage. The identification of hydrometeorological hazards by previous research projects are consistent with the peaks in the impacts reports used in our analysis.
The spatial distribution of areas with highest occurrence of impacts correspond to susceptible areas identified in other studies. Those areas include La Ceiba, Choluteca, Francisco Morazán and Yoro (Figure 2). La Ceiba belongs to Atlántida Department which, according to IHCIT (2012), is the second most prone area to floods (30.2 %). Choluteca, that cover the local governments of San Antonio de Flores and Choluteca, the fourth (23.2 %) of 18 Honduras Departments. Francisco Morazán and Choluteca are also the fourth and fifth Departments with more area vulnerable to landslides, 19.9 % and 17.7 %, respectively (IHCIT, 2012). In a recent work, García-Urquía and Axelsson (2015) studied the rainfall thresholds for the occurrence of urban landslides in Tegucigalpa, Honduras. Departments of Cortés, Francisco Morazán, Choluteca and Yoro, the latter containing the El Progreso local government, are among the top 10 Departments most susceptible to drought, with 39.0, 30.2, 27.4 and 17.36% of their areas, respectively (IHCIT, 2012). The analysis conducted by Westerberg et al, (2010) for Choluteca River basin in central Honduras, encompassing Tegucigalpa, Honduras’ capital, demonstrated the high spatial and temporal variability caused by the diverse precipitation, which generates mechanisms and the complex topography. The municipalities/areas that show more frequent impacts are Distrito Central, San Pedro Sula, El Progreso, La Ceiba, Puerto Cortés, Potrerillos, La Lima, Choloma, San Antonio de Flores y Choluteca (Figure A2).
From November to April, most of the impacts showed in Figure 3, correspond to cold outbreaks and boreal winter “temporales”. A temporal is “a condition of several days of cloudy skies, with at least 24 hours of persistent rains of variable intensity, with outbreaks of rain at any time of the day” (Fallas and Oviedo, 2003). The main impacts associated to these systems are floods and strong winds in the regions affected. As Alfaro and Cortés (2012) summarized, the intrusion of cold fronts in the Caribbean Sea, specifically their arrival to the Gulf of Honduras is one of the conditions that originates the Caribbean temporales in Central America. Whenever such rainy conditions associated with temporales are present in Central America’s Caribbean watershed, the Pacific coast usually remains drier, windier and warmer (Alvarado, 2001). Alfaro and Cortés (2012) add that the concept described recently by Zárate-Hernández (2013) of cold outbreaks includes a synoptic configuration wherever they are present, be it a cold front or a shear line, followed by an advection of cold air, whose main characteristic is a migratory anticyclone in the lower troposphere. Cold fronts, and the accompanying north winds, arrive most frequently to Central America between December and March (Brenes et al, 2003; González, 1999), generally reaching their maximum number of occurrences in January (Zárate-Hernández, 2013). For example, in Costa Rica December and January are the months with more impacts reported, particularly at the Caribbean slope (Retana, 2012; Alfaro and Pérez-Briceño, 2014). These cold winds are locally known as “nortes” (Magaña, Pérez, Vázquez, Carrisoza and Pérez, 1999b).
There are two main hazards, tropical cyclones and easterly waves, associated with most of the impacts from May to October (Figure 3). The main impacts associated to these events are floods. Alvarado and Alfaro (2003) showed that the probability of a tropical cyclone landing in Honduras during hurricane season is approximately 40%. According to Alfaro and Quesada (2010), occurrences in Central America are found from May to December, in addition, the occurrence of tropical cyclones near Central America and the Caribbean basin is more likely (approximately 70%) during the August-September-October (ASO) season (Taylor and Alfaro, 2005; Retana, 2012; Alfaro and Pérez-Briceño, 2014). Alfaro and Quesada (2010) also reported a second peak in the positions of these systems near the isthmus in June followed by a relative minimum in July. This spatial distribution occurrence agrees with the annual impacts maps of these systems showed by Alfaro and Pérez-Briceño (2014) for Costa Rica over the Pacific slope mainly (Retana, 2012). There are two kinds of effects over Central America linked to the pass of these systems through the Caribbean Sea (Peña and Douglas, 2002). The first one is catalogued as “direct”, normally associated with landings and allocated in the Caribbean slope and the second kind is “indirect”, related to the circulation induced from the Pacific Ocean to the Caribbean Sea by low-pressure systems. These effects are normally allocated in the Pacific slope and are locally referred to as Pacific temporales. In the database both types of effects are linked to the occurrence of tropical storms.
According to IHCIT (2012), easterly waves effects are found in Honduras mainly from June to November, linked to precipitation extreme events, which was also found in this study (Figure 3). Serra et al (2010) add that easterly waves interacts with the Inter-Tropical Convergence Zone (ITCZ) in the North Hemisphere in the Pacific and the Atlantic oceans, during boreal summer and autumn. These interactions generate direct and indirect effects (see description above), also associated with atmosphere instability, a very active convective nucleus and strong precipitation events, over almost the whole country, but particularly over the east, central, west and south regions of Honduras (IHCIT, 2012), and related to severe damage in the more vulnerable locations, including the ones identified in this study. According to Serra et al. (2010), these waves could be the trigger of tropical cyclones, which explains why their seasonal distribution is very similar. This agrees with the impacts distribution found by Retana (2012) and Alfaro and Pérez-Briceño (2014) for Costa Rica. . In our study we noted that easterly waves impacts have more evenly spatial distribution throughout the country.
The use of several databases with historical information improves the analysis of the distribution of spatial impacts (Alfaro and Pérez-Briceño, 2014; Amador and Alfaro, 2014, Pérez-Briceño et al, 2016). The foregoing is because some of the events may not be important at a broader scale but are relevant locally and can be considered in the analysis if different databases are used. For example, in October 2008 tropical depression No. 16 caused severe damage for the populations along the Costa Rican Pacific slope (Chinchilla, 2008), including the municipalities of Liberia, Nicoya, Santa Cruz, Bagaces, Carrillo, Cañas, Abangares, Tilarán, Nandayure, Hojancha, Puntarenas and Parrita. This cyclone is not found normally in specific hurricane database like Hurricane Database (HURDAT) from the National Oceanic and Atmospheric Administration (NOAA) because it is not a named storm. Another example is the low-pressure system off the Costa Rican Pacific coast in May 2010 (Alfaro and Quesada, 2010; Chinchilla, Quirós and Stolz, 2010; Alfaro and Pérez-Briceño, 2014). Although it was the tropical storm Agatha only May 29th to the 30th, the main impacts were reported over Costa Rica when the system was still in a low pressure from May 22nd to the 28th. The third example is presented in Figure A3, which shows the variety of spatial occurrences of hydrometeorological impacts on August 2010, based on press reports and aggregated by Department. Results in Figure A3 could be explained according to Maldonado, Alfaro, Fallas and Alvarado (2013). These authors showed that 2010’s boreal autumn’s probability of extreme events along Central America was forecasted mainly as above normal. Enfield and Alfaro (1999) explained that a dipole configuration of the oceans surrounded the isthmus in which the Caribbean Sea was warmer than Equatorial Eastern Pacific, results in high precipitation in Central America, produced by a reduction in the strength of the trade winds. One of the most important factor that enhances the impacts of flooding is precisely the presence of large exposed population, with small resilience to extreme wet events. For example, Figure A3 shows the largest impacts in Francisco Morazán and Cortés Departments, the first and the second most populated ones. Those Departments are also the areas that allocates an important part of the population living in poverty, a factor that can increase the population exposition to climate hazards. The identification of these areas can help local governments in planning for adaptation strategies to climate variability impacts.
Having an accurate description of temporal and spatial precipitation variability in Central America is important for local farming, water supply and flood management, but data quality problems and lack of consistent precipitation data could impede hydrometeorological reporting (Westerberg et al, 2010). The use of press reports was a valuable tool in terms of impacts forecast validation and complemented the information presented in other data bases like DesInventar or EMDAT (Pérez-Briceño et al, 2016). In addition, as described by Zebiak et al (2014), press news could help in the critical role of institutions working at the border between science and society and in the use of seasonal forecast during ENSO warm or cold events. In a long-term iterative process requiring continual maintenance, these organizations serve to enhance the salience, credibility, and legitimacy of forecasts and related climate services.
The spatial analysis of impacts distribution and its relationship with socioeconomic variables is an important input for the application of effective policies aimed to reduce impacts. This analysis allows for the possibility of identifying which indicators are the most important in determining the occurrence of impacts and which places have to be prioritized in the implementation of new strategies for disaster prevention (Pérez-Briceño et al, 2016). For example, in a study conducted between 1985 and 2008 in 108 countries, Ferreira, Hamilton and Vincent (2011) found that in developing countries, income is negatively correlated with the frequency of floods and the highest correlation with droughts is with total Population.
The methodology used in this study can be applied to the other Central American countries (Pérez-Briceño et al, 2016) or other regions (Muñoz et al, 2012); however, two main precautions should be taken in account to compare results among them. The first aspect is that records in disaster databases have different time lengths for each country. Secondly, there is no guarantee that institutions in charge of feeding those data bases use the same methodology and criteria in generating the records. Therefore, standardization process of results should be implemented for each individual country. The presentation of results in terms of relative frequencies can be an alternative to address this point. An additional precaution would be that events with similar magnitude may not be included in the record of different countries as disaster declaration may vary across countries. Since disaster databases are fed at national level, standardization are not generally necessary for studies comparing regions from the same country, unless the information given in the databases mention or identify explicit bias for a particular region.
Guinea-Barrientos, Swain, Wallin and Nyberg (2015) showed that rainfall-induced natural disasters rank first among all natural disasters in Central America. Due to the geographical conditions of the Central American region, it is common that two or more countries are struck by the same rainfall event. One example of this is the 1998 Hurricane Mitch, which affected the entire Central American region, killing more than 18 000 people. As a consequence, Central American countries have started to promote regional policies and programs that aim for better preparation and response to these events, including disaster management cooperation. This study helps to identify the regions that present high occurrences of impacts associated with different hydrometeorological hazards at municipal scale. As an example for disaster prevention, if the information of a hurricane trajectory is provided to the emergency attention institution in Honduras, they can allocate more human and economic resources to the local governments that are in the trajectory of impacts but also in those which have presented more impacts in the past for this particular hazard type, according to the impacts map. Consequently, this study could be used regionally to identify the forums that could be activated when the isthmus experience the impact from a specific hydrometeorological hazard (Muñoz et al, 2012). According to García-Solera and Ramírez (2012), the Central American Climate Outlook Forum (CA-COF) is an actual forum that draws on the capacity of seven weather services in the region to issue three seasonal outlooks per year. This Forum is organized by the Regional Water Resources Committee-Central American Integration System (CRRH-SICA in Spanish), and is responsible for the coordination of activities related to weather forecasts, climate, water resources, and climate change assessment in Belize, Costa Rica, El Salvador, Guatemala, Honduras, Nicaragua, and Panama. CA-COF aims to analyze effects, impacts, and climatic variability projections in sectors including agriculture, water, fisheries, health and nutrition, risk management and energy, and to produce disaster prevention and mitigation strategy, according to the climate forecasts proposed at the end of each forum. CRRH-SICA turns Seasonal Climate Outlooks into risk scenarios used by food-related sectors to support their decisions and minimize food insecurity. This is accomplished as a coordinated effort carried out by specialized entities of the Central American Integration System. Information from the analysis presented here, can be used as an input to inform CA-COF by sharing the results of this research, regarding the possible vulnerable areas that could be impacted by hazards associated with different Seasonal Climate Outlooks.
In addition, the results of this study could be used in conjunction with the precipitation and temperature changes obtained from 21st-century climate change projections from Global Circulation Models (GCMs) (Hidalgo and Alfaro, 2015) along with changes in socioeconomic indicators from local governments to address the future exposition and vulnerability in order to determine the relative influence of climatic and socio-economic variables for different 21st-century projections (Hidalgo and Alfaro, 2012). Hidalgo and Alfaro (2012) generated three-dimensional Climate Change scenarios. These scenarios included two physical variables (precipitation and temperature was always used), and one social parameter at the time, (i.e. expected population, poverty, Human Dimension Index). These scenarios showed the relative weight of these variables for some selected 21st century time-slices. Notice that this methodology could be adapted to include the impacts spatial distribution (actual and future). Another use of the analysis conducted here is to compare the relative situation of each of the countries of Central America, considering climate and socio-economic variables over present and future scenarios (historical, mid-century, and end-of-21st-century), using multidimensional composite maps. Furthermore, as this information is in fine resolution, it is useful for the adaptation of smallholder farmers to climate change in Central America (Hidalgo and Alfaro, 2012). This information could be translated to future impacts by the national and local management institutions dealing with climate change mitigation and adaptation, to plan different strategies for different smallholder farmers and other livelihood groups (Muñoz et al, 2012). Those fine resolution datasets are particularly important for Central America because they allow the conception of climate variability and climate change studies and their impacts in a region of high climatic heterogeneity and, at the same time, help in the decision-making process at the regional scale (municipalities and districts). In this way, national or regional authorities can have more specific information, useful for the adaptation measurements of smallholder farmer.
Hidalgo and Alfaro (2012) found that current north–south socio-economic contrast between the countries is not likely to diminish in the future (southern countries that is Panama and Costa Rica present better living conditions than the rest of the Central American countries, including Honduras);for some projected future conditions, this contrast will be exacerbated by future socio-economic and climate change impact projections. Moreover, Panama and Costa Rica are the only countries that may have improved living conditions at the end of the century when considering increases in gross domestic product (GDP) and the effects of climate change. It is worrisome that the north–south differences in the living standards will keep growing in the region. Attention should be paid given to socio-economic and physical aspects that may play a role in increasing these differences. The inclusion of social aspects is particularly important because runoff climate change projections for the 21st century showed significant reductions in precipitation (as much as 5–10%) and runoff (as much as 10–30%) in northern Central America including Honduras (Hidalgo, Amador, Alfaro and Quesada, 2013). Therefore, the prevalence of severe drought may increase in this sub-region in the future under an A1B emissions scenario. Similarly, during 2050–2099 northern Central America could warm as much as 3°C while southern Central America’s temperature could increase as much as 4°C. The projected dry pattern over Central America is consistent with a southward displacement of the Inter-tropical Convergence Zone (ITCZ). This is also in agreement with the drier conditions presented by IHCIT (2012), for 2025 and 2050 using A2 and B2 scenarios and by Taylor et al (2007) using the same socioeconomic 2080 projections elaborated with the PRECIS regional model. The results of this study can help identifying regions typically affected by different climate hazards. This information, in conjunction with climate change scenarios, could be used by countries in Central America, especially those in the North, allocating their resources for planning adaptation and mitigation strategies and activities in specific regions. The countries that belong to SICA signed the regional strategy for climate change. These countries can use this information as one of the inputs to coordinate in the regional scale, their activities of adaptation and mitigation. Member countries of SICA signed the regional strategy for climate change and can use this information to coordinate their activities of adaptation and mitigation at a regional scale. Different forums, such as those hosted by the CRRH-SICA (García-Solera and Ramírez, 2012) could be used for discussing several aspects in relation to the expected hazards and their impacts´ spatial distribution (Muñoz et al, 2012). This is an aggregate value to plan activities related to future water management and impacts in different socioeconomic sectors.
Acknowledgements
This paper was partially funded by projects 805-B7-286 (UCREA), B6-143 & B7-507 (UCR, CONICIT-MICITT), B4-227, B3-600, B0-065, A4-906 (PESCTMA) and A9-532 (CSUCA-ASDI), from the Center for Geophysical Research (CIGEFI) of the University of Costa Rica (UCR). Thanks to the logistics support provided by the School of Physics of UCR. The authors thank Francisco Jiménez who collaborated in the calculation of some of the indexes.
Appendix A.

Honduras Map
Figure A1. International Boundaries, Departments, relief and Caribbean-Pacific slope division of Honduras
Appendix B.
Definitions of socio economic indexes used
Human Development Index (HDI): A tool developed by the United Nations to measure and rank countries’ levels of social and economic development based on four criteria: Life expectancy at birth, mean years of schooling, expected years of schooling and gross national income per capita.
Poverty: Establish the ability that people can provide food and other basic needs, through the purchase of goods and services based on the household income.
Extreme poverty: a condition characterized by severe deprivation of basic human needs, including food, safe drinking water, sanitation facilities, health, shelter, education and information. It depends not only on income but also on access to services (United Nations, 1995)
Illiteracy rate: Population over 15 (percentage) who cannot write and read a text of little difficulty.
Gini Coefficient: Measures inequality in income distribution.
Appendix C.

The top 10 local governments (municipalities) with more impacts listed
Figure A2. Top 10 local governments (municipalities) with more impacts listed.
Note: IHCIT (2012),
Appendix D.

Spatial occurrences of impacts because of different hydrometeorological hazards for August 2010
Figure A3. Spatial occurrences of impacts due to different hydrometeorological hazards during August 2010, based on press information and classified by Department as a political unit.
References
Alfaro, E. J. & Cortés, J. (2012). Atmospheric forcing of cool subsurface water events in Bahía Culebra, Gulf of Papagayo, Costa Rica. Revista de Biología Tropical, 60 (Suppl. 2), 173-186. Retrieved from: http://www.scielo.sa.cr/scielo.php?script=sci_arttext&pid=S0034-77442012000600012
Alfaro, E.J. & Pérez-Briceño, P.M. (2014). Análisis del impacto de fenómenos meteorológicos en Costa Rica, América Central, originados en los mares circundantes. Revista de Climatología, 14, 1-11. Retrieved from: http://webs.ono.com/reclim9/reclim14a.pdf
Alfaro, E.J. & Quesada, A. (2010). Ocurrencia de ciclones tropicales en el Mar Caribe y sus impactos sobre Centroamérica. Revista Intersedes,11 (22), 136-153. Retrieved from: http://www.redalyc.org/html/666/66620589007/
Alvarado, L., (2001). Boletín Meteorológico Mensual. Resumen sinóptico de enero, 2001:5-8. San José, Costa Rica: Instituto Meteorológico Nacional, Ministerio de Ambiente y Energía,
Alvarado, L. F. & Alfaro, E. J. (2003). Frecuencia de los ciclones tropicales que afectaron a Costa Rica durante el siglo XX. Tópicos Meteorológico y Oceanográficos, 10(1), 1-11.Retrieved from:https://datospdf.com/download/frecuencia-de-los-ciclones-tropicales-que-afectaron-a-costa-rica-durante-el-siglo-xx-_5a44aac7b7d7bc422b8035b2_pdf
Amador, J.A. (2008). The Intra-Americas Sea Low-level Jet, Overview and Future Research. Annall of the New York Academy of Science, 1146:153-188. doi:https://doi.org/10.1196/annals.1446.012
Amador, J. A. (2011). Socio-economic impacts associated with meteorological systems and tropical cyclones in Central America in 2010. In: State of the Climate in 2010, Special Supplement to the Bulletin of the American Meteorological. Society, 92(6), https://journals.ametsoc.org/doi/abs/10.1175/1520-0477-92.6.S1
Amador, J. A. & Alfaro, E. J. (2014). Weather and climate socio-economic impacts in Central America for the management and protection of world heritage sites and the Diquís Delta culture in Costa Rica (a case study). Advances in Geosciences, 35, 157–167. doi:https://doi.org/10.5194/adgeo-35-157-2014
Amador, J. A., Alfaro, E. J., Lizano, O.G. & Magaña, V.O. (2006). Atmospheric forcing of the eastern tropical Pacific: A review. Progress on Oceanography, 69 (2-4), 101–142. doi:https://doi.org/10.1016/j.pocean.2006.03.007
Amador, J.A., Alfaro, E. J., Hidalgo,H & Calderón, B. (2011). Central America. In: State of the Climate in 2010, Special Supplement to the Bulletin of the American. Meteological. Society 92(6). Retrieved from: https://journals.ametsoc.org/doi/abs/10.1175/1520-0477-92.6.S1
Amador, J.A., Alfaro, E. J., Rivera, E. & Calderón, B. (2009). Central America. In: State of the Climate in 2008, Special Supplement to the Bulletin of the American Meteorological. Society 90(8). Retrieved from: https://journals.ametsoc.org/doi/pdf/10.1175/BAMS-90-8-StateoftheClimate
Brenes, C. L., Coen, J. E., Chelton, D. B. , Enfield, D. B., León, S. & Ballestero D. (2003). Wind driven upwelling in the Gulf of Nicoya, Costa Rica. International Journal of Remote Sensing, 24 (5), 1127-1133. doi: https://doi.org/10.1080/0143116021000028632
Cardona, O.D., M. van Aalst, J., Birkmann, M., Fordham, G., McGregor, R., Pérez, R. S. Pulwarty, E. L., Schipper, F. & Sinh, B. T. (2012). Determinants of risk: exposure and vulnerability. In CB. Field, V. Barro, TF .Stocker, D .Qin, DJ .Dokken, KL. Ebi, MD. Mastrandrea, KJ .Mach, GK. Plattner, SK .Alle, M.Tignor, PM. Midgley, (Eds. Managing the Risks of Extreme Events and Disasters to Advance Climate Change Adaptation (pp. 65-108).New York: Cambridge University Press, doi:https://doi.org/10.1017/CBO9781139177245.005
Chinchilla, G. (2008). Comentario meteorológico de Octubre de 2008. Boletín Meteorológico. XXXIII, Octubre 2008. Instituto Meteorológico Nacional. San José, Costa Rica. Retrieved from: http://www.imn.ac.cr/boletin_meteo/historial/2008/BMET102008.pdf
Chinchilla G., E. Quirós, & Stolz, W. (2010). Resumen meteorológico mayo de 2010. Boletín Meteorológico, Instituto Meteorológico Nacional. San José, Costa Rica. Accessed 20 March 2016. Retrieved from: http://www.imn.ac.cr/boletin_meteo/historial%20boletines.html
Centre for Research on the Epidemiology of Disasters [CRED]. (2009). About: EM-DAT, The International Disaster Data Base. Centre for Research on the Epidemiology of Disasters. Retrieved from: http://www.emdat.be/about
Desinventar, (2013). What is DesInventar. Network of Social Studies in the Prevention of Disasters in Latin America. Retrieved from: http://www.desinventar.org/en/desinventar.html]
Enfield, D.B. & Alfaro, E. J. (1999). The dependence of Caribbean rainfall on the interaction of the tropical Atlantic and Pacific Oceans. Journal of Climate, 12, 2093-2103. https://doi.org/10.1175/1520-0442(1999)012<2093:TDOCRO>2.0.CO;2
Enfield, D.B., Mestas, A. M., Mayer, D. A. & Cid-Serrano, L. (1999). How ubiquitous is the dipole relationship in tropical Atlantic sea surface temperatures? Journal of Geophysical Research, 104 (C4), 7841-7848. https://doi.org/10.1029/1998JC900109
Fallas, J.C. & Oviedo, R. (2003). Temporales. Chapter III. In: Fenómenos atmosféricos y cambio climático, visión centroamericana. Instituto Meteorológico Nacional, San José, Costa Rica.
Ferreira, S., Hamilton, K. & Vincent, J. R. (2011). Nature, Socioeconomics and Adaptation to Natural Disasters: New Evidence from Floods. The World Bank Policy Research Working Papers; Washington, D.C. https://doi.org/10.1596/1813-9450-5725
Flores, M., H. Lovo, W. Reyes, and Campos, M. (2009). Cambios en la pobreza y concentración del ingreso en los municipios de Honduras: desde 1988 a 2001. Documento de Trabajo N° 50. Programa Dinámicas Territoriales Rurales. Rimisp, Santiago, Chile.
García-Solera, I. & Ramírez, P. (2012). Central America’s Seasonal Climate Outlook Forum. The Climate Services Partnership. Retrieved from: http://climate-services.org/resource/central-american-climate-outlook-forum
García-Urquía, E. & Axelsson, K. (2015). Rainfall thresholds for the initiation of urban landslides in Tegucigalpa, Honduras: An application of the critical rainfall intensity. Geografiska Annaler: Series A, Physical Geography, 97, 61–83. doi: https://doi.org/10.1111/geoa.12092
González, C. (1999). Climatología de frentes fríos que han afectado Cuba desde 1916-1917 hasta 1996-1997. Revista Cubana de Meteorología, 66: 15-19.
Grover-Kopec, E.K. (2006). Central America and the Caribbean. In: State of the Climate in 2005, Special Supplement to the Bulletin of American Meteorological Society, 87, S68.
Guinea-Barrientos, H.E., Swain, A., Wallin, M. B. & Nyberg, L. (2015). Disaster management cooperation in Central America: the case of rainfall-induced natural disasters. Geografiska Annaler: Series A, Physical Geography, 97, 85–96. doi:https://doi.org/10.1111/geoa.12095
Hidalgo, H. & Alfaro, E. J. (2012). Some Physical and Socio-economical aspects of Climate Change in Central America. Progress in Physical Geography, 36(3), 380 – 399. doi:https://doi.org/10.1177/0309133312438906
Hidalgo, H. G. & Alfaro, E. J. (2015). Skill of CMIP5 Climate Models in Reproducing 20th Century Basic Climate Features in Central America. International Journal of Climatology. 35: 3397–3421.doi: https://doi.org/10.1002/joc.4216
Hidalgo, H. G., Alfaro, E. J. & Quesada-Montano, B. (2017). Observed (1970-1999) climate variability in Central America using a high-resolution meteorological dataset with potential for climate change studies. Climatic Change 141, 13-28. doi:https://doi.org/10.1007/s10584-016-1786-y
Hidalgo, H.G., Amador,J. A., Alfaro, E. J. & Quesada, B. (2013). Hydrological climate change projections for Central America. Journal of Hydrology, 495:94-112. doi:https://doi.org/10.1016/j.jhydrol.2013.05.004
Instituto Hondureño de Ciencias de la Tierra [IHCIT, (2012). Atlas climático y de gestión de riesgo de Honduras. Universidad Nacional Autónoma de Honduras.
IHMC.(n.d). Información por Departamento y Municipio. Secretaría de Estado del Despacho Presidencial. Retrieved from:http://cmapspublic.ihmc.us/rid=1L65T2ZB4-CWT0Q5-2B01/Departamentos%20y%20municipios%20de%20Honduras.pdf
Intergovernmental Panel on Climate Change [IPCC]. (2014). Summary for policymakers. In C. Field, V. Barros, D. Dokken, K. Mach, M. Mastrandrea , T. Bilir …& LL. White (Ed.).Climate Change 2014: Impacts, Adaptation, and Vulnerability. Part A: Global and Sectoral Aspects (pp. 1-32). Cambridge: Cambridge University Press.
Intergovernmental Panel on Climate Change [IPCC]. (2012). Managing the Risks of Extreme Events and Disasters to Advance Climate Change Adaptation. A Special Report of Working Groups I and II of the Intergovernmental Panel on Climate Change, Vol. 1. Cambridge: Cambridge University Press. Retrieved from: https://www.ipcc.ch/pdf/special-reports/srex/SREX_Full_Report.pdf
Jongman, B., Winsemius, H.,Aerts. J., Coughlan de Perez, E., van Aalst, M., Kron, W. & Ward, P. J. (2015). Declining vulnerability to river floods and the global benefits of adaptation. PNAS, 112 (18). doi:https://doi.org/10.1073/pnas.1414439112
Koks, E.E., Jongman, B., Husby, T. G. & Botzen, W. J. W. (2015). Combining hazard, exposure and social vulnerability to provide lessons for flood risk management. Environmental Science and Policy, 47, 42–52. doi:https://doi.org/10.1016/j.envsci.2014.10.013
Kron, W. (2005). Flood Risk = Hazard • Values • Vulnerability. Water International, 30 (1), 58–68.doi:https://doi.org/10.1080/02508060508691837
Magaña, V., Amador, J. A. & Medina, S. (1999a). The Midsummer Drought over Mexico and Central America. Journal of Climate, 12:1577-1588. doi:https://doi.org/10.1175/1520-0442(1999)012<1577:TMDOMA>2.0.CO;2
Magaña, V., Pérez, J., Vázquez, J., Carrisoza, E. & Pérez, J. (١٩٩٩b). Los Nortes. Chapter 2. El Niño y el clima, 34-41. In: V.O. Magaña (ed.). Los Impactos de El Niño en México. México D.F., México: UNAM
Maldonado, T., Alfaro, E. J., Fallas, B. & Alvarado, L. F. (2013). Seasonal prediction of extreme precipitation events and frequency of rainy days over Costa Rica, Central America, using Canonical Correlation Analysis. Advances in Geosciences, 33: 41-52. doi: https://doi.org/10.5194/adgeo-33-41-2013
Mechler, R., & Bouwer, L. M. (2014). Understanding trends and projections of disaster losses and climate change: is vulnerability the missing link?. Climate Change, 133(1):23-35. https://doi.org/10.1007/s10584-014-1141-0
Muñoz, Á.G., Ruiz-Carrascal, D., Ramírez, P., León, G., Quintana, J., Bonilla, A., Torres, W., Pastén, M. & Sánchez, O. (٢٠١٢). Risk Management at the Latin American Observatory, Risk Management-Current Issues and Challenges. InTech, Chapter 22. https://doi.org/10.5772/50788
Narváez, L., Lavell, A. &Pérez, G. (2009). La Gestión del riesgo de desastres: un enfoque basado en procesos. Comunidad Andina. Accessed 3 February 2016. Retrieved from:http://www.comunidadandina.org/predecan/doc/libros/PROCESOS_ok.pdf
Neri, C. & Magaña, V. (2016). Estimation of vulnerability and risk to meteorological drought in Mexico. Weather, Climate and Society, 8: 95-110. doi: https://doi.org/10.1175/WCAS-D-15-0005.1
Peña, M., & Douglas, M. W. (2002). Characteristics of Wet and Dry Spells over the Pacific Side of Central America during the Rainy Season. Monthly. Weater Review, 130, 3054-3073. doi:https://doi.org/10.1175/1520-0493(2002)130<3054:COWADS>2.0.CO;2
Pérez-Briceño, P. M., Alfaro, E., Hidalgo, H. G. & Jiménez, F. (2016). Distribución Espacial de impactos de eventos hidrometeorológicos en América Central. Revista de Climatología, 16, 63-75. Retrieved from:http://webs.ono.com/reclim11/reclim16e.pdf
Retana, J.A. (2012). Eventos hidrometeorológicos extremos lluviosos en Costa Rica desde la perspectiva de la adaptación al cambio en el clima. Tópicos Meteorológicos y Oceanográficos, 11(1):52-64. doi:https://doi.org/10.15359/rca.44-2.1
Serra, Y. L., N. K. George, and Kevin, I. H. (2010). Tracking and Mean Structure of Easterly Waves over the Intra-Americas Sea. Journal of Climate, 23:4823-4840. doi:https://doi.org/10.1175/2010JCLI3223.1
Taylor, M.A., and Alfaro, E. J. (2005). Climate of Central America and the Caribbean. In: Encyclopedia of World Climatology. John E. Oliver (ed.), Springer, Netherlands, pp183-189. Available in: http://www.springer.com/gp/book/9781402032646
Taylor, M. A., Centella, A., Charlery, J., Borrajero, I., Bezanilla, A., Campbell, J, … & Watson, R. (2007). Glimpses of the Future: A Briefing from the PRECIS Caribbean Climate Change Project. Caribbean Community Climate Change Centre. Available in: http://precis.metoffice.com/docs/CCCCC_PRECIS_REPORT.pdf
United Nation Office for Disaster Risk Reduction [UNISDR] (2015). Making Development Sustainable: The Future of Disaster Risk Management. Global Assessment Report on Disaster Risk Reduction. Geneva, Switzerland: UNISDR. Available in: http://www.preventionweb.net/english/hyogo/gar/2015/en/home/download.html
Velásquez, A. & Rosales, C. (1999). Escudriñando en los desastres a todas las escalas. Concepción, metodología y análisis de desastres en América Latina utilizando DesInventar. Cali, Colombia: Red de Estudios Sociales en Prevención de Desastres en América Latina – LA RED. Available in: http://www.desenredando.org/public/libros/1999/edete/edte1_v.1.0-ago-30-2001.pdf
Wilches-Chaux, G. (1993). La Vulnerabilidad Global. In A. Maskrey (Ed). Los Desastres no son naturales. Red de Estudios Sociales en Prevención de Desastres de América Latina - La Red. Available in: http://www.desenredando.org/public/libros/1993/ldnsn/html/cap2.htm
Westerberg, I., Walther, A. , Guerrero, J. L., Coello, Z., Halldin, S, Xu, C. Y., & Lundin, L. C. (2010). Precipitation data in a mountainous catchment in Honduras: quality assessment and spatiotemporal characteristics. Theorical and Applied Climatology, 101, pp. 381–396. doi:https://doi.org/10.1007/s00704-009-0222-x
Zárate-Hernández, E. (2013). Climatología de masas invernales de aire frío que alcanzan Centroamérica y el Caribe y su relación con algunos índices Árticos. Tópicos Meteorológicos y Oceanográficos, 12(1),35-55.
Zebiak, S.E., Orlove, B., Muñoz, A. G., Vaughan, C., Hansen, J., Troy, T., Thomson… & Garvin, S. (2014). Investigating El Niño-Southern Oscillation and society relationships .WIREs. Climate Change, 6, pp.17–34. doi: https://doi.org/10.1002/wcc.294
1 Center for Geophysical Research, University of Costa Rica, 2060-San Pedro, Costa Rica
2 School of Physics, University of Costa Rica, 2060-San Pedro, Costa Rica
3 Center for Research in Marine Sciences and Limnology, University of Costa Rica, 2060-San Pedro, Costa Rica
4 School of Geography, University of Costa Rica, 2060-San Pedro, Costa Rica.
Este artículo de la Revista de Política Económica y Desarrollo Sostenible tiene una licencia de Creative Commons Reconocimiento-NoComercial-SinObraDerivada 3.0 Costa Rica.