ISSN: 1659-455X • e-ISSN: 1659-407X
Vol. 17 (2), julio-diciembre 2025
Recepción 4 marzo 2025 • Corregido 28 octubre 2025 • Aceptado 29 octubre 2025
DOI: https://dx.doi.org/10.15359/revmar.17-2.9
 |
Microplastic pollution on beaches in Crucita, Ecuador: Polymer abundance and composition Contaminación por microplásticos en las playas de Crucita, Ecuador: abundancia y composición de polímeros Karen Bravo-Sánchez1, Andrea García-Palma2, Lelly Useche-Castro3 & Jean Pérez-Parra*2 |
ABSTRACT
Coastal environments worldwide face a significant and growing threat from microplastic pollution. This study quantified microplastic abundance and identified microplastic polymer types in the sand of three beaches in Crucita, Ecuador: Crucita (parish seat), Las Gilces, and La Boca. Sand samples were collected in September 2024 along 100-meter transects in the high tide zone. Ten sampling points were randomly selected per transect, and the subsamples were combined to form three composite samples per beach. The analytical process involved sorting the particles into two-dimensional categories: 1-5 mm (by sieving) and <1 mm (by density separation with NaCl and filtration). Microplastic abundance was quantified in both fractions. Polymer composition of the 1-5 mm fraction was analyzed using FTIR spectroscopy. For the 1-5 mm fraction, mean abundance was between 0.58 and 1.09 items/kg, whereas for the <1 mm fraction, it varied between 653.33 and 1,460 items/kg. Although abundance levels varied, the differences between the beaches were not statistically significant for either size fraction. Polypropylene was the most common polymer in the 1-5 mm fraction, followed by polyethylene and polyurethane. Notably, a terpolymer composed of styrene, acrylonitrile, and methyl methacrylate was identified exclusively at La Boca, the beach located at the mouth of the Portoviejo River. This finding strongly suggests a fluvial transport pathway for less common industrial polymers. These results provide the first baseline assessment of microplastic contamination in this area and highlight the need to implement waste management strategies for both land-based and riverine sources.
Keywords: Microplastics, beach sand, Crucita beach, polypropylene, coastal pollution
RESUMEN
En el nivel global, los entornos costeros enfrentan una amenaza significativa y creciente debido a la contaminación por microplásticos. En este estudio se cuantificó la abundancia e identificó los tipos de polímeros de los microplásticos presentes en la arena en tres playas de Crucita, Ecuador: Crucita (cabecera parroquial), Las Gilces y La Boca. Se recolectaron muestras de arena en septiembre de 2024 a lo largo de transectos de 100 metros en la zona de pleamar. Se seleccionaron aleatoriamente diez puntos de muestreo por transecto, y las submuestras se combinaron para formar tres muestras compuestas por playa. El análisis consistió en clasificar las partículas en dos categorías de tamaño: 1-5 mm (mediante tamizado) y <1 mm (mediante separación por densidad con NaCl y filtración). Se cuantificaron los microplásticos en ambas fracciones. La composición de polímeros de la fracción de 1-5 mm se analizó por espectroscopía FTIR. Para la fracción de 1-5 mm, la abundancia media estuvo entre 0.58 y 1.09 ítems/kg, mientras que para la fracción <1 mm, esta varió entre 653.33 y 1 460 partículas/kg. Aunque los niveles de abundancia variaron, las diferencias entre las playas no fueron estadísticamente significativas para ninguna de las dos fracciones de tamaño. El polipropileno fue el polímero más común en la fracción de 1-5 mm, seguido por el polietileno y el poliuretano. Cabe destacar que también se identificó un terpolímero de estireno, acrilonitrilo y metacrilato de metilo, encontrado exclusivamente en La Boca, la playa situada en la desembocadura del río Portoviejo. Este hallazgo sugiere una vía de transporte fluvial para polímeros industriales menos comunes. Estos resultados proporcionan la primera línea de base sobre la contaminación por microplásticos en esta zona y enfatizar la importancia de implementar estrategias de gestión de residuos dirigidas tanto a fuentes terrestres como fluviales.
Palabras clave: microplásticos, arena de playa, playa Crucita, polipropileno, contaminación costera.
Microplastics are small plastic particles less than 5 mm in size, originating from the breakdown of larger plastic items or manufactured for specific uses such as in cosmetics and cleaning products (Saeedi, 2024). Microplastics come from diverse sources, such as personal hygiene products and the waste from larger plastic objects (Ranjan & Singh, 2024). The inefficient collection and inappropriate management of plastic waste also contribute significantly to the massive amounts of microplastics entering various ecosystems, including oceans, rivers, soil, and even the air (Jangir et al. 2024).
Based on their origin, microplastics fall into two main groups. The first group is primary microplastics, which are manufactured at microscopic sizes for direct use in specific applications, such as microbeads in cosmetic products. In contrast, secondary microplastics are formed through the environmental degradation and fragmentation of larger plastic items (Cherian et al. 2024).
The presence of microplastics represents a threat to both ecosystems and human health. In aquatic ecosystems, the ingestion of microplastics by marine life can cause physical damage, reproductive issues, and even death (Ghosh et al. 2023). Furthermore, the ability of microplastics to act as vectors for other pollutants increases their toxic effects (Zambrano-Pinto et al. 2024). Terrestrial ecosystems are also affected, as microplastics modify soil’s physical and chemical characteristics, thereby altering plant growth and soil microorganism activity (Guo et al. 2020). Another negative aspect of microplastics in soil is their bioaccumulation and biomagnification resulting from their incorporation into the food chain via soil organisms (Lloyd-Jones et al. 2023; Okeke et al. 2023). Both ingestion and inhalation of microplastics by humans have been associated with adverse health effects; among these, endocrine alterations, respiratory problems, and digestive problems are notable. It has also been determined that they can lead to a greater risk of cancer and diabetes (Ghosh et al. 2023). In addition to all the adverse health effects previously mentioned, microplastics can also leach toxic chemicals recognized as endocrine disruptors, such as bisphenol A (BPA) and phthalates, thereby further increasing the risk to human health (Bhat et al. 2022). Given the negative impacts of microplastics on human health and ecosystems, it is necessary to both identify and study the main sites where these materials can accumulate. Beaches are among these sites, as they are where larger plastics break down into smaller particles. This occurs either through exposure to sunlight (UV radiation), physical abrasion, or contact with water (Piehl et al. 2019). On beaches, plastic particles that arrive from both land-based and oceanic sources also combine (Thepwilai et al. 2021; Li et al. 2023). This makes beach sand an ideal environment to study this contamination problem (Wilson et al. 2021), which in turn is influenced by anthropogenic factors, such as inadequate waste disposal, poor plastic waste management, and tourism in coastal areas (Thepwilai et al. 2021; Li et al. 2023; Lloyd-Jones et al. 2023). The concentration of microplastics in beach sand has been correlated with its proximity to urban areas and effluent discharge points (Gobiraj et al. 2024). The accumulation of plastic particles on beaches affects the aesthetics and health of their ecosystems, particularly the biota, as many organisms consume them. All the foregoing highlights the importance of conducting studies or monitoring to generate information on this issue, which in turn can be used to establish waste management policies to reduce the environmental risks posed by plastic pollution (Álvarez-Zeferino et al. 2020; Jones et al. 2022).
The province of Manabí is located on the central coast of Ecuador and is known for its beautiful beaches, which have made it an important tourist destination that also contributes to the local economy (Zambrano Santos et al. 2022). Within this province, the canton of Portoviejo is home to some of the most visited beaches in the region: Crucita, La Boca, and Las Gilces. Crucita, for example, is one of the main tourist destinations, where its local economy depends heavily on tourism (Pérez-Chávez & Zambrano-Montesdeoca, 2023). These beaches play an important ecological role for the region and also support local communities that depend on both artisanal fishing and tourism (Arroyo Cobeña & Jalil Vélez, 2019). On these beaches, there is a growing anthropogenic pressure, generated on the one hand by tourism development and fishing activity (Macías Carrillo, 2018), and on the other hand, by the inadequate management of waste, particularly plastics, thereby becoming a threat to the coastal ecosystems of this region (Alcívar Saltos et al. 2023). Based on the foregoing and given the importance of the beaches of the Portoviejo canton for both tourism and its local economy, and also considering the potential environmental problems that microplastic pollution may be generating on these beaches, it then becomes necessary to carry out an evaluation of the levels of microplastics on the beaches of Crucita, La Boca, and Las Gilces that allows for the identification of potential sources and that also serves to guide the implementation of both management and mitigation plans for microplastic pollution, in order to safeguard these important ecosystems and ensure their long-term preservation. The objective of this study was therefore to determine the abundance, characteristics, and distribution of microplastics in the sand of these three beaches, starting with the quantification of microplastic abundance, then identifying the predominant polymer types using the FTIR spectroscopy technique, and finally, comparing the pollution levels among the beaches, considering the potential sources of origin and the anthropogenic activities associated with each area. It is also expected that the findings of this study will serve as a source of information for the development of management and mitigation strategies for plastic pollution in these coastal ecosystems.
Study area
The research we present was conducted on three beaches of the Crucita parish, which belongs to the Portoviejo canton of the Manabí province, Ecuador. The coastal area of this parish extends for approximately 13 km. This area has a concave shape, which is characteristic of many beaches in Manabí. It also features cliffs and modest deltaic formations. The predominant economic activities in the parish are tourism, artisanal fishing, and agriculture. A sampling point was established on each beach. The first sampling point was located on the beach adjacent to the parish’s main urban center. This section of beach, approximately 4 km long. The immediate surroundings correspond to the main urban settlement of Crucita, with a high concentration of buildings and tourism-related activities. The primary use of this beach is intensive tourism, although artisanal fishing also takes place. The second sampling site, Las Gilces, is located 4.3 km north of the Crucita parish seat, adjacent to the Las Gilces community. The main uses of this beach are artisanal fishing and tourism, the latter being less intensive than in the Crucita parish seat. The third sampling site, La Boca, is located 7.9 km north of the Crucita parish seat, immediately south of the mouth of the Portoviejo River. The surrounding environment is marked by the presence of the Portoviejo River. The main economic activity in this area is tourism. Figure 1 presents a map of Crucita parish showing the locations of the three sampling sites, as well as their locations within Ecuador.
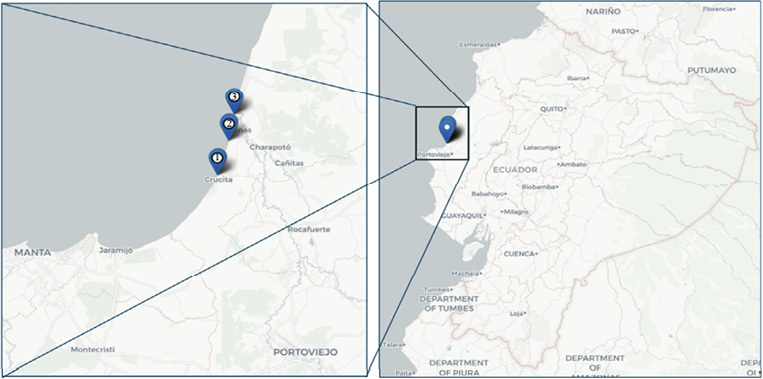
Fig. 1. Map of the study area within Crucita parish, Portoviejo canton, province of Manabí, Ecuador, indicating the three microplastic sampling locations: Crucita (1), Las Gilces (2), and La Boca (3) along the coastline. The inset map positions the study area within Ecuador
Fig. 1. Mapa del área de estudio dentro de la parroquia Crucita, cantón Portoviejo, provincia de Manabí, Ecuador, indicando los tres lugares de muestreo de microplásticos: Crucita (1), Las Gilces (2) y La Boca (3) a lo largo de la costa. El mapa posiciona el área de estudio dentro de Ecuador
Sampling design
Sampling was conducted in September 2024 at three beach areas within the Crucita parish: Crucita (parish seat), Las Gilces, and La Boca. At each beach, a 100-meter linear transect was established parallel to the coastline within the high-tide zone (high-tide line). The specific location of each transect was determined visually in the field, selecting a representative area of each beach and avoiding areas with obvious obstacles or disturbances.
Along each 100-meter transect, 20 equidistant points were marked at 5-meter intervals. From these 20 pre-established points, 10 sampling points were randomly selected (Vázquez Morillas et al. 2020). The location of the sampling points along the transect and the sampling design are illustrated in Figure 2. Random selection was performed using Microsoft Excel. This procedure ensured an unbiased distribution of sampling points along each transect and systematic coverage of the study area.
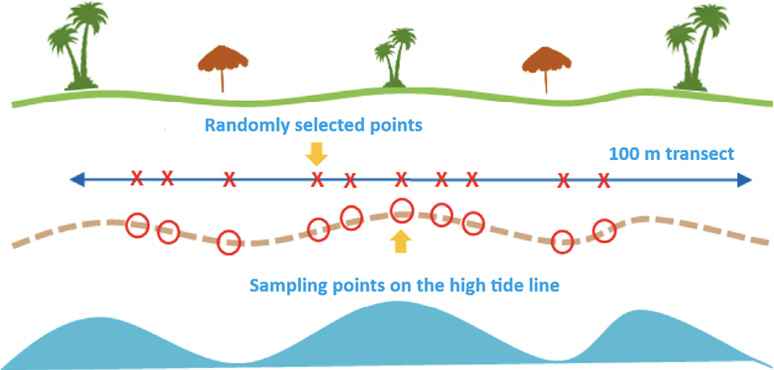
Fig. 2. Schematic representation of the sampling design used at each beach. A 100 m transect was established on the high tide line, and 10 sampling points were randomly selected along the transect (Vázquez Morillas et al. 2020)
Fig. 2. Representación esquemática del diseño de muestreo utilizado en cada playa. Se estableció un transecto de 100 m en la línea de marea alta y se seleccionaron aleatoriamente 10 puntos de muestreo a lo largo del transecto (Vázquez Morillas et al. 2020)
For each beach area, the sand samples collected at the 10 sampling points were combined to form three composite samples. Two of the composite samples were created from the sand of three sampling points each, and the third composite sample was created from the sand of the remaining four sampling points. This resulted in 9 composite samples (3 per beach area).
Sample collection
At each of the 10 randomly selected sampling points along the 100-meter transect, a surface sand subsample was collected using an improvised cylindrical corer, consisting of a polypropylene (PP) plastic pot measuring 0.20 m in diameter and 0.18 m in height, which had an external line drawn 5 cm from the top edge to indicate the sampling depth. The pot was inserted vertically into the sand until the marked line was flush with the sand surface. Once the pot was inserted to the 5 cm mark, the surrounding sand was carefully removed, exposing its side walls. Subsequently, a sheet made of polypropylene (PP) was slid underneath the base of the pot to separate the sand subsample contained within. The subsample, along with the pot and the sheet, was carefully removed from the ground. The sand contained in the pot, representing the top 5 cm of sediment, was transferred to an individual bag made of low-density polyethylene (LDPE) with a 20,000 g capacity, previously labeled with a unique code identifying the beach, the transect number, and the sampling point number within the 20 pre-established points. As an additional measure to minimize potential contamination of the samples by plastic particles from the bags, each bag was pre-filled with sand from the sampling site, which was subsequently discarded immediately before collecting each subsample. Subsequently, in the laboratory, the sand subsamples from each beach were combined according to the following scheme to form three composite samples, as shown in Table 1. The sampling point numbers (1-20) correspond to the points pre-established every 5 meters along the 100-meter transect. Of these 20 points, 10 were randomly selected for subsample collection.
Table 1. Composition scheme for sand samples from Crucita, Las Gilces, and La Boca beaches
Tabla 1. Esquema de composición para muestras de arena de las playas de Crucita, Las Gilces y La Boca
|
Composite sample |
Beach |
Sampling points included (from the 20 pre-established) |
|
1 |
Crucita |
1, 3, 5 |
|
2 |
Crucita |
7, 8, 11 |
|
3 |
Crucita |
13, 15, 18, 20 |
|
4 |
Las Gilces |
2, 7, 8 |
|
5 |
Las Gilces |
11, 12, 13 |
|
6 |
Las Gilces |
16, 17, 18, 19 |
|
7 |
La Boca |
1, 3, 4 |
|
8 |
La Boca |
5, 7, 9 |
|
9 |
La Boca |
14, 15, 16, 20 |
To ensure the integrity of the samples and prevent contamination, specific precautions were followed during the entire process. Since both the pot and the sheet used for subsample collection were made of polypropylene (PP), an additional measure was implemented to minimize potential contamination from PP particles shed by these implements. Before each collection, the inner surfaces of the pot and the sheet surface were rubbed with sand from the sampling site, which was then discarded. Additionally, direct contact of the subsamples with other plastic materials was avoided. The individual subsamples, contained in the LDPE bags, were transported immediately to the laboratory for processing and compositing.
Sample processing in the laboratory
Upon arrival at the laboratory, the nine composite samples (three from each beach area) were processed following the procedure described below:
● Wet mass measurement: Immediately upon arrival at the laboratory, the mass of each composite sample (wet sand + bag) was recorded using a Camry electronic balance, model ACS-15-JC21, with a precision of 5 g. To obtain the mass of the wet sand, the mass of the empty low-density polyethylene (LDPE) bag was subtracted from the total mass of the composite sample (wet sand + bag). The average mass of the empty LDPE bags was determined using ten identical, unused bags, and this average value was used for the correction.
● Drying: Each composite sample was carefully transferred from its original LDPE bag to a pre-weighed and labeled aluminum tray. The samples were then oven-dried for 24 hours at 105°C. A sample was considered to have reached constant weight when the mass difference between two consecutive weighings, separated by a 24-hour interval, was less than 1 g. To avoid contamination while drying, the containers were thoroughly pre-cleaned with filtered deionized water.
Microplastic separation and quantification
Microplastic separation and quantification were performed in two stages, based on particle size:
● Separation of 1-5 mm Microplastics (Sieving)
After drying and dry mass measurement, separation of the 1-5 mm microplastic size range was achieved for each of the composite sand samples using two stainless-steel sieves (1 mm and 4.75 mm mesh). The sieves were stacked, with the 4.75 mm sieve on top and the 1 mm sieve on the bottom. The entire dry sand sample was carefully placed on the top sieve. The sieve stack was then agitated manually for 5 minutes.
Following sieving, the fraction captured by the 1 mm sieve, consisting of particles between 1 and 4.75 mm, was carefully placed into a Petri dish using a stainless-steel spatula. This material was subsequently used for visual inspection and quantification of the 1-5 mm microplastics.
● Separation of < 1 mm microplastics (density separation and filtration)
To separate and quantify microplastics smaller than 1 mm, a 50 g subsample was taken from each dry composite sample. A concentrated sodium chloride (NaCl) solution was first prepared by dissolving 370 g of NaCl in 2 L of distilled water under constant stirring. To ensure its purity, this solution was then filtered through a 1.2 µm glass microfiber filter (Minipore). Then, a 200 mL volume of the filtered saline solution was mixed with the subsample. The mixture was shaken manually for 3 minutes. Subsequently, the mixture was allowed to settle for 5 hours to allow phase separation. The supernatant (containing the microplastics) was carefully decanted and filtered through a binder-free, glass microfiber filter, grade GF3, from CHMLAB, with a pore size of 1.2 µm, using vacuum filtration with a MXBAOHENG diaphragm vacuum pump, model GM-0.5A. The filter with the retained microplastics was placed in a quartz crucible and dried in an electric heating drying oven, Rebelk brand, model RS-40, at a temperature of 60°C before visual inspection. Microplastic quantification was performed by microscopic observation using a Nikon Eclipse E200 microscope at a magnification of 4x. The entire filter surface was counted.
Microplastic characterization using infrared spectroscopy (FTIR)
The identification of the constituent polymers of the 1-5 mm microplastic particles was performed with Fourier-Transform Infrared Spectroscopy (FTIR). For this analysis, 11 microplastic particles were randomly selected from the 1-5 mm sieved samples. FTIR analysis was performed using a Thermo Scientific Nicolet Summit PRO spectrometer equipped with a diamond Everest Attenuated Total Reflectance (ATR) accessory. Each selected particle was placed directly onto the diamond crystal of the ATR accessory. To ensure good contact between the particle and the crystal, and thus obtain high-quality spectra, light pressure was applied to the sample using a clean contact tip. Infrared spectra were acquired over the spectral range of 500 cm-1 to 4,000 cm-1, with a spectral resolution of 4 cm-¹ and 16 scans per sample. To identify the polymer, the acquired spectra were matched against reference spectral libraries integrated into the instrument’s software. A positive match was considered when the similarity percentage exceeded 80%.
Quality control and contamination prevention
To prevent sample contamination, rigorous measures were implemented during both sampling and lab analysis. Before use, all glassware underwent cleaning by washing and rinsing with filtered deionized water, and laboratory surfaces were wiped clean. To minimize airborne contamination, samples were covered with aluminum foil whenever possible. The polypropylene (PP) sampling pot and sheet were pre-conditioned by rubbing them with local sand that was then discarded to minimize shedding from the tools themselves. Furthermore, procedural blanks were processed alongside the samples to monitor background contamination.
Statistical analysis
To compare mean microplastic abundance (both for the 1-5 mm and < 1 mm fractions) among the three beach areas, a one-way analysis of variance (ANOVA) was performed. Prior to analysis, the Shapiro-Wilk test was used to assess normality, and Levene’s test was used to assess homogeneity of variances. Because the ANOVA assumptions were not met across all data sets, the nonparametric Kruskal-Wallis test was also used. Due to the small sample size (n = 3 composite samples per beach), post-hoc tests were not performed. A significance level of α = 0.05 was established for all statistical tests. Analyses were performed using the statistical software R, version 4.2.2 (R Core Team, 2022) and RStudio, version 2023.06.1+524 (RStudio Team, 2023).
Microplastic abundance (1-5 mm)
Microplastic abundance in the composite sand samples from the three beaches is presented in Table 2. The mean microplastic abundance was 0.58 ± 0.17 (0.40 - 0.72) items/kg in Crucita, 1.09 ± 0.63 (0.62 - 1.81) items/kg in Las Gilces, and 0.89 ± 0.23 (0.64 - 1.10) items/kg in La Boca. A one-way ANOVA revealed no significant difference in microplastic abundance between the three beaches (F (2, 6) = 2.308, P = 0.179). Similarly, a Kruskal-Wallis test showed no significant difference in microplastic abundance between the three beaches (H = 3.2667, df = 2, P = 0.1953).
Table 2. Microplastic abundance (1-5 mm) in composite sand samples from Crucita, Las Gilces, and La Boca beaches
Tabla 2. Abundancia de microplásticos (1-5 mm) en muestras de arena compuesta de las playas Crucita, Las Gilces y La Boca
|
Beach |
Sample |
Dry sand mass (kg) |
Number of microplastics (1-5 mm) |
items/kg dry sand |
|
Crucita |
C1 |
12.447 |
8 |
0.6427 |
|
Crucita |
C2 |
12.654 |
5 |
0.3951 |
|
Crucita |
C3 |
12.564 |
9 |
0.7163 |
|
La Gilces |
G1 |
8.253 |
7 |
0.8482 |
|
La Gilces |
G2 |
7.164 |
13 |
1.8146 |
|
La Gilces |
G3 |
9.666 |
6 |
0.6207 |
|
La Boca |
B1 |
9.072 |
10 |
1.1023 |
|
La Boca |
B2 |
8.762 |
8 |
0.9131 |
|
La Boca |
B3 |
7.758 |
5 |
0.6445 |
Microplastic abundance (< 1 mm)
Microplastic abundance in the < 1 mm size fraction in the composite sand samples from the three beaches is presented in Table 3. For the determination of microplastic abundance in this size fraction, a 50 g subsample of each composite sample was analyzed. The mean microplastic abundance (< 1 mm) was 653.33 ± 643.44 (200 - 1,400) items/kg in Crucita, 1286.67 ± 400.92 (1,020 - 1,740) items/kg in Las Gilces, and 1460 ± 418.69 (1,000 - 1,820) items/kg in La Boca. A one-way ANOVA revealed no significant difference in microplastic abundance (< 1 mm) between the three beaches (F (2, 6) = 2.865, P = 0.133). Similarly, a Kruskal-Wallis test showed no significant difference in microplastic abundance (< 1 mm) between the three beaches (H = 5.5556, df = 2, P = 0.06218).
Table 3. Microplastic abundance (< 1 mm) in composite sand samples from Crucita, Las Gilces, and La Boca beaches
Tabla 3. Abundancia de microplásticos (< 1 mm) en muestras de arena compuesta de las playas de Crucita, Las Gilces y La Boca
|
Beach |
Composite sample |
Microplastic abundance (< 1 mm) (items/kg) |
|
Crucita |
C1 |
360 |
|
Crucita |
C2 |
1 400 |
|
Crucita |
C3 |
200 |
|
La Gilces |
G1 |
1 100 |
|
La Gilces |
G2 |
1 020 |
|
La Gilces |
G3 |
1 740 |
|
La Boca |
B1 |
1 820 |
|
La Boca |
B2 |
1 000 |
|
La Boca |
B3 |
1 560 |
Microplastic morphology
The microplastics identified in the samples were predominantly irregular fragments, with smaller proportions of films and fibers. Representative photographs of the most common morphologies are shown in Figure 3.
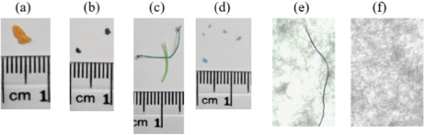
Fig. 3. Representative morphologies of identified microplastics and quality control. Microplastics in the 1-5 mm range: (a) fragment, (b) fragments, (c) fiber, (d) films. Microplastics < 1 mm viewed under the microscope on a filter: (e) individual fiber, (f) clean filter used as a procedural blank. The scale in (a-d) is in centimeters
Fig. 3. Morfologías representativas de los microplásticos identificados y control de calidad. Microplásticos en el rango de 1-5 mm: (a) fragmento, (b) fragmentos, (c) fibra, (d) películas. Microplásticos < 1 mm vistos al microscopio sobre un filtro: (e) fibra individual, (f) acumulación de fibras. La escala en (a-d) está en centímetros
Polymer composition (FTIR Results)
The polymer composition of the 1-5 mm microplastics, as determined by FTIR spectroscopy. A total of 11 particles were analyzed, of which 3 were from Crucita, 4 from Las Gilces, and 4 from La Boca. Overall, polypropylene (PP) was the predominant polymer identified, comprising 45.5% of the total particles analyzed. Polyethylene (PE) was also a common polymer, accounting for a total of 27.3% of particles; this was composed of low-density polyethylene (LDPE, 9.1%) and other polyethylene types (18.2%). The remaining particles were identified as Polyurethane (PU, 18.2%) and a styrene, acrylonitrile, and methyl methacrylate terpolymer (S-AN-MMA, 9.1%).
Las Gilces showed the least diverse polymer composition, with only PP and PE identified. Crucita presented PP, PE and PU. La Boca, in contrast, had the most diverse composition, including PP, LDPE, PU, and S-AN-MMA. LDPE and S-AN-MMA were exclusively found in La Boca samples. The representative FTIR spectra for particles identified as PP, LDPE, PU, and S-AN-MMA (Fig. 4, 5, 6, and 7), respectively, each with a detailed assignment of its characteristic bands.
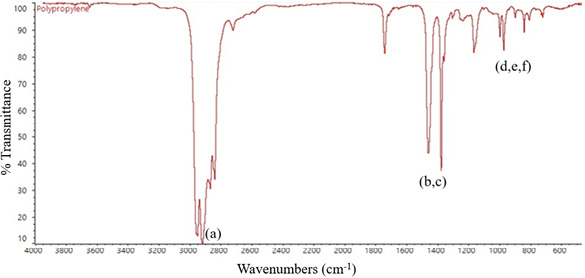
Fig. 4. Representative FTIR spectrum of a microplastic particle identified as polypropylene (PP) from Las Gilces beach. The identification of polypropylene was confirmed by (a) the aliphatic C–H bond stretching vibrations (ν(C-H)) in the 2,950 – 2,838 cm-1 region, (b and c) the methyl group bending vibrations (δ(CH3)) at 1,456 cm-1 and 1,377 cm-1, and (d, e, f) the set of characteristic bands in the fingerprint region, located at 1,167, ~998 - 973, and 841 cm-1
Fig. 4. Espectro FTIR representativo de una partícula de microplástico identificada como polipropileno (PP) de la playa Las Gilces. La identificación del polipropileno se confirmó por (a) las tensiones de los enlaces C-H alifáticos (ν(C–H)) en la región de 2 950 - 2838 cm-1, (b y c) las vibraciones de flexión del grupo metilo (δ(CH3)) en 1 456 cm-1 y 1 377 cm-1, y (d, e, f) el conjunto de bandas características en la región de huella dactilar, ubicadas en 1167, ~998 - 973 y 841 cm-1
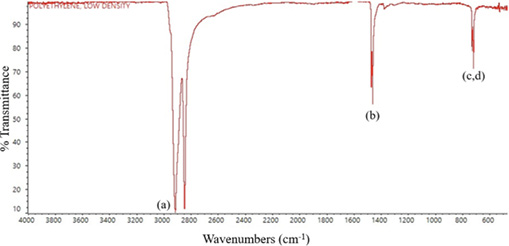
Fig. 5. Representative FTIR spectrum of a microplastic particle identified as low-density polyethylene (LDPE) from La Boca beach. The identification was confirmed by (a) the C-H stretching vibrations (ν(C–H)) at 2,916 and 2,849 cm-1, (b) the CH2 bending vibration (δ(CH2)) at 1,472 cm-1, and (c, d) the characteristic splitting of the CH2 rocking vibration (ρ(CH2)), with peaks at ~730 cm-1 (crystalline phase) and ~720 cm-1 (amorphous phase)
Fig. 5. Espectro FTIR representativo de una partícula de microplástico identificada como polietileno de baja densidad (LDPE) de la playa La Boca. La identificación se confirmó por (a) las tensiones v(C-H) en 2 916 y 2 849 cm-1, (b) la flexión δ(CH2) en 1 472 cm-1, y (c, d) el desdoblamiento característico de la vibración de oscilación (rocking) ρ(CH2), con picos en ~730 cm-1 (fase cristalina) y ~720 cm-1 (fase amorfa)
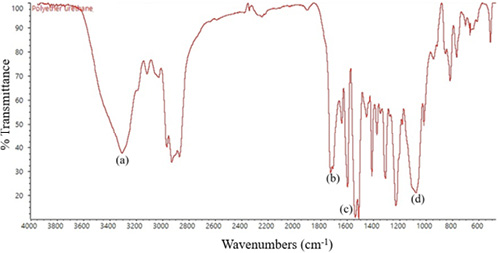
Fig. 6. Representative FTIR spectrum of a microplastic particle identified as Polyurethane (PU) from Crucita beach. The identification of polyurethane was confirmed by the presence of (a) the N-H bond stretching vibration (ν(N-H)) in the 3,320-3,350 cm-1 region, (b) the carbonyl group stretching (ν(C=O)) between 1,725 – 1,700 cm-1, (c) the Amide II bending band (δ(N-H)) near 1,550 – 1,530 cm-1, and (d) the characteristic ether linkage stretching (ν(C-O-C)) in the 1,100 – 1,060 cm-1 zone
Fig. 6. Espectro FTIR representativo de una partícula de microplástico identificada como Poliuretano (PU) de la playa Crucita. La identificación del poliuretano se confirmó por la presencia de (a) la vibración de tensión del enlace N-H (ν(N-H)) en la región de 3 320 - 3 350 cm-1, (b) la tensión del grupo carbonilo (ν(C=O)) entre 1 725 - 1 700 cm-1, (c) la banda de flexión Amida II (δ(N-H)) cerca de 1 550 - 1 530 cm-1, y (d) la tensión característica del enlace éter (ν(C-O-C)) en la zona de 1 100 - 1 060 cm-1
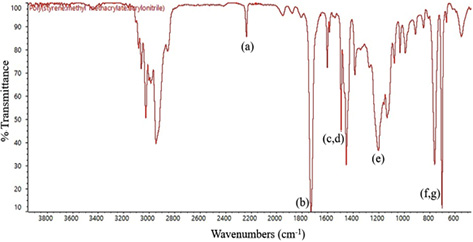
Fig. 7. Representative FTIR spectrum of a microplastic particle identified as a styrene, acrylonitrile, and methyl methacrylate terpolymer (S/AN/MMA) from La Boca beach. The identification was confirmed by (a) the nitrile group stretching vibration (ν(C≡N)) at ≈ 2,240 cm-¹, (b) the ester carbonyl stretching (ν(C=O)) in the 1,730 – 1,715 cm-1 region, (c-d) the aromatic ring stretching vibrations (ν(C=C)) at ~1,600 and 1,493 cm-¹, (e) the C-O ester bond stretching in the 1,190 – 1,140 cm-1 zone, and (f-g) the characteristic aromatic C–H out-of-plane bending bands (γ(C–H)) at ~758 and ~700 cm-1
Fig. 7. Espectro FTIR representativo de una partícula de microplástico identificada como un terpolímero de estireno, acrilonitrilo y metacrilato de metilo (S/AN/MMA) de la playa La Boca. La identificación se confirmó por (a) la vibración de tensión del grupo nitrilo (ν(C≡N)) en ≈ 2 240 cm-¹, (b) la tensión del carbonilo del éster (ν(C=O)) en la región de 1 730 - 1 715 cm-1, (c-d) las vibraciones de tensión del anillo aromático (ν(C=C)) en ~1 600 y 1 493 cm-¹, (e) la tensión del enlace C-O del éster en la zona de 1 190 - 1 140 cm-1, y (f-g) las bandas de flexión C–H fuera del plano (γ(C-H)) características del anillo aromático en ~758 y ~700 cm-1
This study investigated microplastic contamination in three beach areas within Crucita parish, Ecuador: Crucita (the parish seat), Las Gilces, and La Boca. Microplastics were detected in all composite sand samples, confirming the widespread presence of this type of pollution in this coastal environment. While mean microplastic abundance varied between beaches in both the 1-5 mm and < 1 mm size fractions, these differences were not statistically significant (1-5mm: ANOVA, F (2,6) = 2.308, P = 0.179; Kruskal-Wallis, H = 3.2667, df = 2, P = 0.1953. <1mm: ANOVA, F (2, 6) = 2.865, P = 0.133; Kruskal-Wallis, H = 5.5556, df = 2, P = 0.06218). This lack of significant difference may be attributed to several factors, including the limited number of composite samples analyzed (n = 3 per beach), which reduces statistical power. The compositing approach, necessary to obtain sufficient sample mass for analysis, inherently averages out small-scale spatial variations that might exist within each 100-meter transect. Furthermore, the three beaches, while having distinct local uses and proximity to potential sources, are all located within the same parish and are likely subject to similar regional influences, such as ocean currents and prevailing winds, that could contribute to a more homogeneous distribution of microplastics. Furthermore, it should be noted that this study provides a snapshot in time, as it is based on a single sampling event in September 2024, and therefore does not capture any potential temporal variations in microplastic abundance or composition.
The observed mean abundance for the 1-5 mm microplastics (ranging from 0.58 to 1.09 items/kg) is, in a global context, lower than levels reported in some other regions. For example, in the South Andaman Islands, India, Patchaiyappan et al. (2020) reported a higher average abundance of microplastics in beach sediments (414.35 ± 87.4 particles/kg). The levels we have found in our research for the <1 mm fraction (ranging from 653.33 to 1460 items/kg) are considerably higher than those reported by Patchaiyappan et al. (2020) in their study, which highlights the importance of analyzing this smaller size fraction because it is very easy for particles of this size to be ingested by marine organisms. Furthermore, it is worth noting that one must be careful when directly comparing abundance data between different studies, considering the differences in methodologies, particularly in the size fractions analyzed and the units in which the results are reported, as is the case in the study by Martinelli Filho & Monteiro (2019) in South America, where abundance was presented in units of volume. Regarding the composition of the microplastics found in the 1-5 mm fraction, it was determined that polypropylene (PP) was the predominant polymer. These results agree with those obtained in other studies on microplastic pollution (Eo et al. 2018; Ríos-Mendoza et al. 2021; Al Nabhani et al. 2022). The predominance of PP is due to it being a polymer used in the manufacturing of many common products, such as for example packaging, containers, and in materials used for fishing. The presence or polyethylene (PE) is also related to its common use in packaging and single-use plastics, which is why this was an expected finding. In samples from the Crucita and La Boca beaches, polyurethane (PU) was found, which is a polymer that also has many applications in everyday products such as foams, coatings, and personal protective equipment like face masks (Jimoh et al. 2023), the use of which increased considerably during the COVID-19 pandemic. On the other hand, finding an S-AN-MMA in the sample from La Boca beach is not very common and this justifies further investigation. Although the pathways for how this terpolymer reaches the environment have not been widely documented, it can be inferred that its routes are the same as those already well-established for widespread microplastic pollution, with the main pathway into the marine environment being in the form of secondary microplastics produced by the fragmentation of larger plastic items, which end up becoming marine debris (Babaniyi et al. 2024; Sinha, 2024). This degradation is, in addition, accelerated by environmental factors such as photooxidation and mechanical action (Auta et al. 2017; Frapiccini et al. 2019). Once generated, these microplastic particles are transported to the ocean through various pathways, such as for example urban runoff, and effluents from wastewater and industrial treatment plants (Manojkumar et al. 2023; Kushwaha et al. 2024).
The fact that La Boca beach is located just south of the mouth of the Portoviejo River means that this river very likely acts as a transport medium for urban, industrial, and agricultural waste, with the presence of plastics, from the city of Portoviejo and other urban centers surrounding the riverbed to the coast. This is consistent with research in Peru, where higher microplastic concentrations were observed near river estuaries (Luque-Fernández et al. 2023). The presence of S-AN-MMA exclusively in La Boca samples further supports the hypothesis of a riverine or localized point-source origin for this less common polymer.
Among the limitations of this study, the following can be mentioned: first, the small number of composite samples (n = 3 per beach) limits the statistical power to detect differences between beaches. Furthermore, the flotation method used, based on a concentrated NaCl solution, is not effective for high-density polymers such as PET and PVC; consequently, the reported microplastic abundance is likely an underestimation of the total plastic load. On the other hand, the absence of a chemical digestion step for organic matter means that some natural particles could have been misidentified as microplastics (false positives), potentially leading to an overestimation, particularly for smaller particles. The visual identification method may also have overlooked transparent or colorless particles, especially microfibers. Finally, the analysis focused on a limited number of particles by FTIR.
Future research in Crucita parish should prioritize: (1) increasing the sample size and spatial resolution of sampling to better characterize microplastic distribution; (2) investigating temporal variations in microplastic abundance and composition; (3) identifying specific sources of microplastics, particularly for less common polymers like the S-AN-MMA terpolymer, potentially through the analysis of riverine and wastewater inputs; and (4) evaluating the potential ecological consequences of microplastic consumption by local marine fauna.
This study confirmed the widespread presence of microplastics in sand samples from three beaches (Crucita, Las Gilces, and La Boca), within Crucita parish, Ecuador, an area reliant on tourism and artisanal fishing. Microplastics were present across all locations and in both size fractions examined (1-5 mm and < 1 mm). While mean abundance varied, no statistically significant differences among beaches were found, a result likely attributable to the small number of samples.
Polymer analysis of the 1-5 mm fraction revealed a predominance of polypropylene, followed by polyethylene and polyurethane. Notably, a styrene-acrylonitrile-methyl methacrylate terpolymer was also identified. The exclusive presence of this terpolymer in La Boca, situated immediately south of the Portoviejo River mouth, strongly suggests the river is a probable transport pathway for this less common polymer. These results, while constrained by the study’s limitations, provide a valuable baseline for future research and emphasize the need for targeted waste management interventions to protect the coastal ecosystems of Crucita parish.
Al Nabhani, K., Salzman, S., Shimeta, J., Dansie, A. & Allinson, G. (2022). A temporal assessment of microplastics distribution on the beaches of three remote islands of the Yasawa archipelago, Fiji. Mar. Pollut. Bull., 185, 114202. https://doi.org/10.1016/j.marpolbul.2022.114202
Alcivar Saltos, M. E., Cobo Litardo, E. T., Zambrano Barros, N. A. & Rizzo Alcivar, D. F. (2023). Injusto reparto de beneficios y cargas del turismo en Crucita-Ecuador. Un diagnóstico de sostenibilidad turística del destino. LATAM Rev. Latinoam. Cienc. Soc. Humanidades, 4(3), 520-533. https://doi.org/10.56712/latam.v4i3.1093
Alvarez-Zeferino, J. C., Ojeda-Benítez, S., Cruz-Salas, A. A., Martínez-Salvador, C. & Vázquez Morillas, A. (2020). Dataset of quantification and classification of microplastics in Mexican sandy beaches. Data Brief, 33, 106473. https://doi.org/10.1016/j.dib.2020.106473
Arroyo Cobeña, M. V. & Jalil Vélez, N. J. (2019). El turismo como indicador viable para el desarrollo local de la parroquia Crucita del cantón Portoviejo. Mikarimin. Rev. Cient. Multidiscip., 5(2), 01-12.
Auta, H. S., Emenike, C. U. & Fauziah, S. H. (2017). Distribution and importance of microplastics in the marine environment: a review of the sources, fate, effects, and potential solutions. Environ. Int., 102, 165-176. https://doi.org/10.1016/j.envint.2017.02.013
Babaniyi, B. R., Adebomi, J. I., Olowoyeye, B. R. & Daramola, O. E. (2024). Microplastics, marine debris, and marine green contamination. In S. A. Aransiola, O. A. Oyewole, N. R. Maddela, U. J. J. Ijah, & B. Manjunatha (Eds.) Marine Greens: Environmental, Agricultural, Industrial and Biomedical Applications (pp. 26-34). EE. UU. CRC Press.
Bhat, M. A., Gedik, K. & Gaga, E. O. (2022). Environmental toxicity of emerging micro and nanoplastics: a lesson learned from nanomaterials. In A. H. Dar & G. A. Nayik (Eds.), Nanotechnology Interventions in Food Packaging and Shelf Life (pp. 331-338). EE. UU. CRC Press.
Cherian, E., Mohan, L. & Manoj, S. E. (2024). Microplastics and nanoplastics and related chemicals: the physical-chemical interactions. In T. Altalhi & V. C. Fernandes (Eds.), Toxic Effects of Micro- and Nanoplastics: Environment, Food and Human Health (pp. 73-86). EE. UU. Scrivener Publishing. https://doi.org/10.1002/9781394238163.ch4
Eo, S., Hong, S. H., Song, Y. K., Lee, J., Lee, J. & Shim, W. J. (2018). Abundance, composition, and distribution of microplastics larger than 20 µm in sand beaches of South Korea. Environ. Pollut., 238, 894-902. https://doi.org/10.1016/j.envpol.2018.03.096
Frapiccini, E., Pellini, G., Gomiero, A., Scarcella, G., Guicciardi, S., Annibaldi, A., ... Marini, M. (2019). Microplastics and polycyclic aromatic hydrocarbons occurrence in a demersal fish (Solea solea) in the Adriatic Sea. In M. Cocca, E. Di Pace, M. E. Errico, G. Gentile, A. Montarsolo, R. Mossotti, & M. Avella (Eds.), Proceedings of the 2nd International Conference on Microplastic Pollution in the Mediterranean Sea (pp. 226-233). Switzerland. Springer. https://doi.org/10.1007/978-3-030-45909-3_35
Ghosh, S., Sinha, J. K., Ghosh, S., Vashisth, K., Han, S. & Bhaskar, R. (2023). Microplastics as an emerging threat to the global environment and human Health. Sustain., 15(14), 10821. https://doi.org/10.3390/su151410821
Gobiraj, S., Kuganathan, S., Grøsvik, B. E. & Amarathunga, A. A. D. (2024). Initial examination of marine microplastics along Jaffna Peninsula’s coastal stretch in the Palk Strait, northern Sri Lanka. Environ. Sci. Pollut. Res., 31(56), 65022-65033. https://doi.org/10.1007/s11356-024-35530-w
Guo, J.-J., Huang, X.-P., Xiang, L., Wang, Y.-Z., Li, Y.-W., Li, H., … Wong, M.-H. (2020). Source, migration and toxicology of microplastics in soil. Environ. Int., 137, 105263. https://doi.org/10.1016/j.envint.2019.105263
Jangir, B., Mochi, S. & Yadav, A. (2024). Detection and extraction techniques for microplastics. In N. K. Jangid & R. Sharma (Eds.) Microplastics: Detection, Extraction, Remediation Techniques, and Future Perspectives (pp. 21-41). EE. UU. CRC Press.
Jimoh, J. O., Rahmah, S., Mazelan, S., Jalilah, M., Olasunkanmi, J. B., Lim, L.-S., … Liew, H. J. (2023). Impact of face mask microplastics pollution on the aquatic environment and aquaculture organisms. Environ. Pollut., 317, 120769. https://doi.org/10.1016/j.envpol.2022.120769
Jones, J. S., Guézou, A., Medor, S., Nickson, C., Savage, G., Alarcón-Ruales, D., … Lewis, C. (2022). Microplastic distribution and composition on two Galápagos island beaches, Ecuador: Verifying the use of citizen science derived data in long-term monitoring. Environ. Pollut., 311, 120011. https://doi.org/10.1016/j.envpol.2022.120011
Kushwaha, M., Shankar, S., Goel, D., Singh, S., Rahul, J., Rachna, K. & Singh, J. (2024). Microplastics pollution in the marine environment: A review of sources, impacts and mitigation. Mar. Pollut. Bull., 209, 117109. https://doi.org/10.1016/j.marpolbul.2024.117109
Li, Y., Xiao, P., Donnici, S., Cheng, J. & Tang, C. (2023). Spatial and seasonal distribution of microplastics in various environmental compartments around Sishili Bay of North Yellow Sea, China. Mar. Pollut. Bull., 186, 114372. https://doi.org/10.1016/j.marpolbul.2022.114372
Lloyd-Jones, T., Dick, J. J., Lane, T. P., Cunningham, E. M. & Kiriakoulakis, K. (2023). Occurrence and sources of microplastics on Arctic beaches: Svalbard. Mar. Pollut. Bull., 196, 115586. https://doi.org/10.1016/j.marpolbul.2023.115586
Luque-Fernández, C. R., Alcelay, I., Villegas Paredes, L. & Bocardo-Delgado, E. (2023). Primera aproximación a la presencia de microplásticos en playas arenosas de la provincia de Islay (Arequipa), sur del Perú. Rev. Int. Contam. Ambient., 39, 285-293. https://doi.org/10.20937/RICA.54664
Macias Carrillo, V. A. (2018). Contaminación Ambiental de la Playa Crucita por el Eviscerado de la Pesca Artesanal. (Tesis de Ingeniería Ambiental). Universidad Estatal del Sur de Manabí, Jipijapa.
Manojkumar, Y., Gopal, B., Sumanth, C., Pilli, S., Tyagi, R. D. & Pandey, A. (2023). Occurrence of microplastics and nanoplastics in marine environment. In R. D. Tyagi, A. Pandey, P. Drogui, S. Pilli, & B. Yadav (Eds.) Current Developments in Biotechnology and Bioengineering: Bioprocesses and Products from Wastes (pp. 151-181). Netherlands. Elsevier.
Martinelli Filho, J. E. & Monteiro, R. C. P. (2019). Widespread microplastics distribution at an Amazon macrotidal sandy beach. Mar. Pollut. Bull., 145, 219-223. https://doi.org/10.1016/j.marpolbul.2019.05.049
Okeke, E. S., Chukwudozie, K. I., Addey, C. I., Okoro, J. O., Chidike Ezeorba, T. P., Atakpa, E. O., … Nwuche, C. O. (2023). Micro and nanoplastics ravaging our agroecosystem: A review of occurrence, fate, ecological impacts, detection, remediation, and prospects. Heliyon, 9(2). e13296. https://doi.org/10.1016/j.heliyon.2023.e13296
Patchaiyappan, A., Ahmed, S. Z., Dowarah, K., Jayakumar, S. & Devipriya, S. P. (2020). Occurrence, distribution and composition of microplastics in the sediments of South Andaman beaches. Mar. Pollut. Bull., 156, 111227. https://doi.org/10.1016/j.marpolbul.2020.111227
Pérez-Chávez, E. K. & Zambrano-Montesdeoca, J. L. (2023). Tourism and its impact on the economic development of the Crucita-Ecuador. MQRInvestigar, 7(3), 1590-1606. https://doi.org/10.56048/MQR20225.7.3.2023.1590-1606
Piehl, S., Mitterwallner, V., Atwood, E. C., Bochow, M. & Laforsch, C. (2019). Abundance and distribution of large microplastics (1–5 mm) within beach sediments at the Po River Delta, northeast Italy. Mar. Pollut. Bull., 149, 110515. https://doi.org/10.1016/j.marpolbul.2019.110515
R Core Team. (2022). R: A language and environment for statistical computing (Version 4.2.2). R Foundation for Statistical Computing. https://www.r-project.org/
Ranjan, D. & Singh, L. (2024). Sustainable management of microplastics. In A. Kumar & V. Singh (Eds.) Microplastics Pollution and its Remediation (pp. 317-343). Singapur. Springer Nature.
Rios-Mendoza, L. M., Ontiveros-Cuadras, J. F., Leon-Vargas, D., Ruiz-Fernández, A. C., Rangel-García, M., Pérez-Bernal, L. H. & Sanchez-Cabeza, J.-A. (2021). Microplastic contamination and fluxes in a touristic area at the SE Gulf of California. Mar. Pollut. Bull., 170, 112638. https://doi.org/10.1016/j.marpolbul.2021.112638
RStudio Team. (2023). RStudio (Version 2023.06.1+524). Posit Software, PBC. https://posit.co/download/rstudio-desktop/
Saeedi, M. (2024). How microplastics interact with food chain: a short overview of fate and impacts. J. Food Sci. Technol., 61(3), 403-413. https://doi.org/10.1007/s13197-023-05720-4
Sinha, S. (2024). Plastic debris, microplastics, and marine pollution. In M. Goel & N. G. Tripathi (Eds.) Plastic Pollution: Challenges and Green Solutions (pp. 79-98). Singapore. Springer Nature.
Thepwilai, S., Wangritthikraikul, K., Chawchai, S. & Bissen, R. (2021). Testing the factors controlling the numbers of microplastics on beaches along the western Gulf of Thailand. Mar. Pollut. Bull., 168, 112467. https://doi.org/10.1016/j.marpolbul.2021.112467
Vázquez Morillas, A., Cruz Salas, A. A., Álvarez Zeferino, J. C., Rosado Piña, V. L., Beltrán Villavicencio, M., Mendoza Sánchez, M., … Velasco Pérez, M. (2020). Monitoreo de microplásticos en playas. México. Universidad Autónoma Metropolitana, Unidad Azcapotzalco.
Wilson, D. R., Godley, B. J., Haggar, G. L., Santillo, D. & Sheen, K. L. (2021). The influence of depositional environment on the abundance of microplastic pollution on beaches in the Bristol Channel, UK. Mar. Pollut. Bull., 164, 111997. https://doi.org/10.1016/j.marpolbul.2021.111997
Zambrano Santos, Z. L., Navajas Romero, V. & Ceular Villamandos, N. (2022). La realidad del turismo en Manabí (Ecuador) y la economía circular como potencial de sostenibilidad turística. Rev. Int. Turismo, Emp. Terr., 6(1), 134-150. https://doi.org/10.21071/riturem.v6i1.14014
Zambrano-Pinto, M. V., Tinizaray-Castillo, R., Riera, M. A., Maddela, N. R., Luque, R. & Díaz, J. M. R. (2024). Microplastics as vectors of other contaminants: Analytical determination techniques and remediation methods. Sci. Total Environ., 908, 168244. https://doi.org/10.1016/j.scitotenv.2023.168244
1 Carrera de Química. Facultad de Ciencias Básicas. Universidad Técnica de Manabí, Ecuador. kbravo8779@utm.edu.ec ORCID: https://orcid.org/0009-0005-8853-9346
2 Departamento de Química. Facultad de Ciencias Básicas. Universidad Técnica de Manabí, Ecuador. andrea.garcia@utm.edu.ec ORCID: https://orcid.org/0009-0000-1982-0904 jean.perez@utm.edu.ec* ORCID: https://orcid.org/0000-0002-7971-1782
3 Departamento de Matemáticas y Estadística. Facultad de Ciencias Básicas. Universidad Técnica de Manabí, Ecuador. lelly.useche@utm.edu.ec ORCID: https://orcid.org/0000-0002-4294-9009
|
|