Rev. Mar. Cost. ISSN 1659-455X. Vol. 4: 157-168, Diciembre 2012.
https://doi.org/10.15359/revmar.4.11
Otolith shape analysis as a tool for population discrimination
of the white grunt (Haemulon plumieri) stock in the
northern coast of the Yucatan Peninsula, Mexico
Análisis de la forma del otolito como una herramienta para la discriminación poblacional del stock del ronco
blanco (Haemulon plumieri) en la costa norte
de la Península de Yucatán, México
Christina Treinen-Crespo1, Harold Villegas-Hernández1, Sergio Guillén-Hernández1, Miguel Ángel Ruiz-Zárate1 & Carlos González-Salas1*
1 Universidad Autónoma de Yucatán, Departamento de Biología Marina, Km. 15.5, carretera Mérida-Xmatkuil, A.P. 4-116 Itzimná, C.P. 97100, Mérida, Yucatán, México. carlos.gonzalez@uady.mx*, calinectes@gmail.com
Recibido 31-III-2012
Aceptado 9-VIII-2012
ABSTRACT
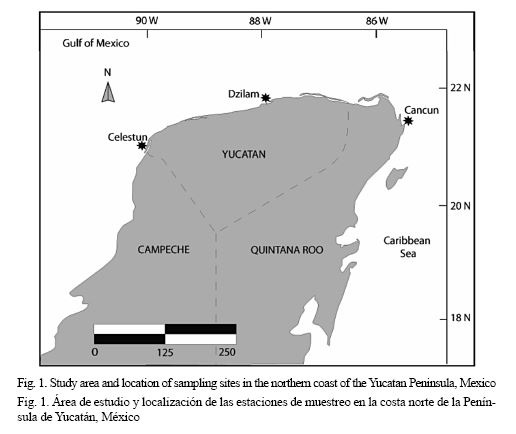
In this study, the population structure of the white grunt (Haemulon plumieri) from the northern coast of the Yucatan Peninsula was determined through an otolith shape analysis based on the samples collected in three locations: Celestún (N 20°49’,W 90°25’), Dzilam (N 21°23’, W 88°54’) and Cancún (N 21°21’,W 86°52’). The otolith outline was based on the elliptic Fourier descriptors, which indicated that the H. plumieri population in the northern coast of the Yucatan Peninsula is composed of three geographically delimited units (Celestún, Dzilam, and Cancún). Significant differences were observed in mean otolith shapes among all samples (PERMANOVA; F2, 99 = 11.20, P = 0.0002), and the subsequent pairwise comparisons showed that all samples were significantly differently from each other. Samples do not belong to a unique white grunt population, and results suggest that they might represent a structured population along the northern coast of the Yucatan Peninsula.
Keywords: Haemulon plumieri, otolith shape, stock, discrimination.
RESUMEN
En este estudio, la estructura de la población del ronco blanco (Haemulon plumieri) de la costa norte de la Península de Yucatán fue determinada a través del análisis de la forma del otolito, sobre la base de las muestras recolectadas en tres localidades: Celestún (N 20°49’, W 90°25’), Dzilam (N 21°23’, W 88°54’) y Cancún (N 21° 21’, O 86° 52’). El análisis del contorno de los otolitos se basó en los descriptores elípticos de Fourier, cuyo enfoque indicó que la población de H. plumieri en la costa norte de la Península de Yucatán se compone al menos de tres unidades delimitadas geográficamente (Celestún, Dzilam y Cancún). Se observaron diferencias significativas en la forma del otolito entre todas las muestras (PERMANOVA, F2, 99 = 11.20, P = 0.0002) y las comparaciones por pares posteriores indicaron que todas las muestras fueron significativamente diferentes una de otra. Al parecer, las muestras no pertenecen a una única población, y los resultados sugieren que podría representar una población bien estructurada a lo largo de la costa norte de la Península de Yucatán.
Palabras claves: Haemulon plumieri, forma del otolito, población, discriminación.
INTRODUCTION
The white grunt, Haemulon plumieri (Lacepède 1801), is a tropical fish, distributed along the Atlantic coast from the Chesapeake Bay (United States of America) through to the northern coast of Brazil. Although H. plumieri has not been reported as one of the main targeted fish resources of local fishery in the Gulf of Mexico, particularly in the northern coast of the Yucatan Peninsula, it may be considered a bycatch species due its contribution to the catch occurred mainly by association with other fisheries such as snappers (Lutjanidae) and groupers (Serranidae and Epinephelinae) (SAGARPA, 2006). The main concern is that those target exploited species have undergone more stringent fishery regulations now than in the past; their catch has decreased consequently increasing fishing pressure on alternative species, such as the white grunt. Therefore, it is necessary to evaluate whether there is evidence about the population structure or if this remains as a single panmictic population along the northern coast of the Yucatan Peninsula.
The population or stock unit concept is fundamental for fisheries management because it is the basic unit on which population dynamic models are applied both to know its status and to adopt appropriate management measures to ensure its sustainability (Abaunza et al. 2008). Many stocks or populations display differences in spawning season and location, and in their life-history parameters (McQuinn, 1997). Because of larval dispersal and adult migrations, units that spawn in separate locations often mix at nursery and feeding grounds (Mosegaard & Madsen, 1996), causing uncertainty in their management. It has been shown that stock or population identification is an interdisciplinary field that involves the recognition of self-sustaining components within natural populations and is a central theme in fisheries science and management (Cadrin et al. 2005). Understanding the structure is very important when managing the multi-stock commercial fisheries because different stocks may respond differently to exploitation (Campana & Casselman, 1993). An efficient tool that has been used to distinguish between stocks or population components based on phenotypic characteristics is the use of otolith shape analysis, which is an easily determined measure of identification since it is species-specific and barely variable with growth (Campana & Casselman, 1993). Otolith morphometrics provides a phenotypic based-assessment since the variation in these characteristics is probably evidence that distinct geographical regions are partially occupied throughout the life history of fish (Ihssen et al. 1981; Casselman et al. 1981), thus geographic variation in otolith shapes could be related to population differences (Begg & Brown, 2000; Stransky, 2005). In this sense, otolith shape has been used in many stock-discrimination studies (DeVries et al. 2002; Cardinale et al. 2004; Stransky et al. 2008), with levels of classification success ranging from 60% to 95% for interstock separation, depending on the species. Therefore, our study assesses the use of the otolith shape analysis as a phenotypic-based approach for discriminating the white grunt populations from the northern coast of the Yucatan Peninsula, with the aim of using the method in the assessment of the white grunt population, and thus other species stocks.
MATERIALS AND METHODS
Sampling
This study was conducted in the northern coast of the Yucatan Peninsula where three geographically distinctive populations of white grunt were sampled in Celestún, Dzilam de Bravo and Cancún, (Fig. 1). In January 2010, 173 post-settled white grunts were collected with hauls using an epibenthic trawl net on selected areas with depths less than 1.5 meters where the seagrass Thalassia testudinum dominates. Only the specimens that belonged to the genus Haemulon were fixed in 97% ethanol for further revision and identification in the laboratory. Post-settled individuals were chosen because they are the key phase where biological dispersal occurs and, therefore, it is the most appropriate phase for analysis of stock structure of marine species with pelagic larval dispersal (Jones & Barber, 2005).
Once in the laboratory, the collected specimens were identified as Haemulon plumieri according to the identification keys of the family Haemulidae (Lindeman, 1986; Lindeman & Toxey, 2002). Total length (TL) and standard length (SL) were measured. Otoliths were removed from each specimen with the aid of a stereo microscope with the “open the hatch method” described by Secor et al. (1992), and later cleaned and stored dry in vials properly labeled. In this study we used the pair of otoliths called sagitta instead of the other pairs of otoliths (lapillus and asteriscus) because they are bigger and show low degrees of intraspecific variation (Secor et al. 1992). Finally, white transmitted light high-contrast photos, with the aid of a stereo microscope, were taken for each otolith previously placed over a black surface (to minimize distortion errors in the normalization process, the sulcus side from the otolith always faced down and the rostrum always pointed at the same direction). Each photo was properly labeled for subsequent use during shape analysis.
Otolith shape analysis
Otolith shape analysis was based on the elliptical Fourier shape analysis (Kuhl & Giardina, 1982). Using this analysis any outline is reduced to its x- and y-projection, and it is expressed by Fourier expansions as an infinite sum of successive waves of cosines with a specific amplitude and angle. The amplitude of the wave is the elliptic Fourier shape descriptor, also known as the harmonic (Kuhl & Giardina, 1982; González-Salas & Lenfant, 2007; Villegas-Hernández et al. 2008). The contribution of each harmonic, with both x- and y-variations, is an ellipse, and the harmonics for the x- and y - coordinates are computed by the incremental changes in the x- and y-direction. From the incremental changes in the x-direction two Fourier coefficients (an + bn) are computed for the nth harmonic, also known as the elliptic Fourier shape descriptors (EFDs), and from the incremental changes in the y-direction there are two other Fourier coefficients (cn + dn). Therefore, the amplitude of each harmonic describing the otolith outline can be calculated by adding four Fourier coefficients (an + bn + cn + dn) for the nth harmonic (Kuhl & Giardina, 1982; González-Salas & Lenfant, 2007). Using digital photographs of otoliths of all specimens, the otolith shape of H. plumieri helped calculate the EFDs and the amplitudes of each harmonic with the Shape 1.2 software (Iwata & Ukai, 2002). This program has the advantage of providing a normalization process of the EFDs, which effectively removes the sensitivity to irrelevant information such as location, size and orientation of the object (Kuhl & Giardina 1982; González-Salas & Lenfant, 2007; Villegas-Hernández et al. 2008). Once the EFDs and the amplitudes of each harmonic were calculated it was necessary to estimate the number of harmonics needed to effectively describe the otolith shape with the average Fourier Power spectrum (FP), which measures the amount of shape information (Renaud et al. 1996; Pothin et al. 2006). For the nth harmonic, the Fourier Power is given by the expression: FPn = (A2n+B2n+C2n+D2n) /2, where An, Bn, Cn and Dn are the Fourier coefficients of the nth harmonic. Then, the cumulative average power spectrum of Fourier (FPC), defined by FPC = å1n FPn., is calculated and, with the number of harmonics that reach > 99% of the total variation from FP, the total number of harmonics required for relevant statistical analysis is established (Pothin et al. 2006). The first harmonic represents the initial point or mean radius of the shape (a perfect ellipse), thus it is not relevant for the analysis (Renaud et al. 1996); consequently, the coefficients corresponding to this harmonic were eliminated.
Data analysis
The amplitudes of the elliptic Fourier shape descriptors were used to determine differences in mean otolith shapes among the three white grunt geographical populations. However, it should be noted that, due the nature of the data from the otolith shape analysis, the involved otolith shape variables did not follow a normal distribution. For this reason, instead of using a common parametric statistical approach, all comparisons were conducted using a permutational multivariate analysis of variance (PERMANOVA; Anderson, 2005), which allows testing the simultaneous response of one or more variables to one or more factors in the ANOVA experimental design. This also permits partitioning the multivariate variation (defined by the distance of the measure used) according to individual factors in any fully balanced multi-way ANOVA design to estimate the statistical probabilities associated with differences between levels of each factor (Anderson, 2001). The PERMANOVA was based on the Bray-Curtis dissimilarity measure (4 999 random permutations). When it was significant at 95% confidence, the levels of each factor were analyzed through a posteriori pairwise comparison also using 4 999 random permutations to obtain probability values, which subsequently were modified with sequential Bonferroni correction to validate the multiple comparison tests (Rice, 1989). In order to support the PERMANOVA in determining differences among subpopulations, a non-parametric generalized discriminant analysis (Anderson & Robinson, 2003) was also carried out to test the classification success of a number of discriminant functions to predict the identity of the white grunt population, using a data array of the harmonic coefficients (4 coefficients x n harmonics). The Mahalanobis generalized distance (D2; Mahalanobis, 1936) was also calculated to characterize the differences in the otolith shape among white grunt populations. Finally, the performance of discriminant functions was evaluated using jackknife cross-validation procedures and Cohen’s Kappa statistics, which represents an objective means of calculating the chance-corrected percentage of agreement between actual and predicted groups. Kappa values range from 0 to 1, where 0 indicates that the discriminant analysis yields no improvement over chance and 1 perfect agreement (Titus et al. 1984).
RESULTS
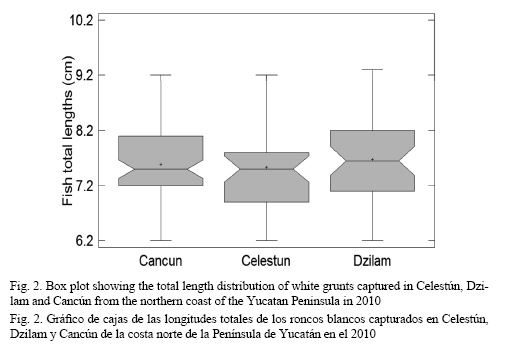
A total of 173 white grunt juveniles were collected: 43 from Celestún, 48 from Dzilam, and 82 from Cancún. In order to avoid any possible bias about inferences of stock structure, only specimens between 6.0 and 10.0 cm long were used to ensure that those individuals came from at least contemporary reproductive events. This criterion was considered since, for this species, the spawning season extends throughout the year, with peaks in February-April and August-October. Size of maturity for this species occurred at 309 mm TL (275 mm FL) for females and at 357 mm TL (317 mm FL) for males (Palazón-Fernández, 2007). Thus, only 34, 42, and 67 specimens from Celestún, Dzilam and Cancún white grunt populations, respectively, were used for further otolith shape analysis. The mean total length ± standard deviation (cm) per population used in further analyses is shown in Fig. 2. White grunts from Cancún, Celestún and Dzilam populations averaged 7.58 ± 0.64, 7.53 ± 0.74, and 7.67 ± 0.77, respectively.
Otolith shape analysis
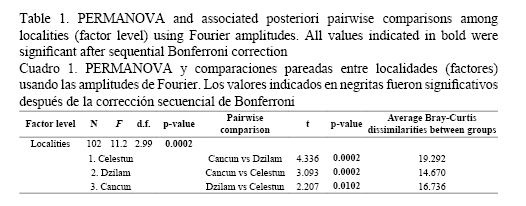
The calculation of the cumulative average FPC indicated that the first 13 harmonics were enough to describe the mean shape of the sagitta otolith of H. plumieri from the northern coast of the Yucatan Peninsula. As mentioned earlier, the first harmonic is not relevant for statistical analysis; therefore, only the Fourier coefficients and amplitudes from the subsequent 12 harmonics were used. The PERMANOVA indicated differences in mean otolith shapes among the three white grunt populations (F2, 99 = 11.20, P = 0.0002) and the subsequent pairwise comparisons showed that all populations were significantly different from each other even after sequential Bonferroni correction (P < 0.0167) (Table 1). It is worth mentioning that the PERMANOVA analysis had to be carried out with only 34 samples per population because the current version of the program only handles balanced experimental designs (Anderson, 2005).
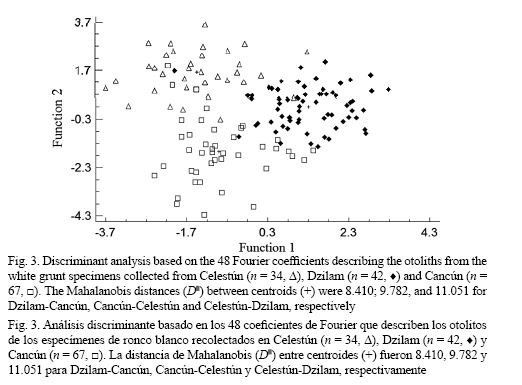
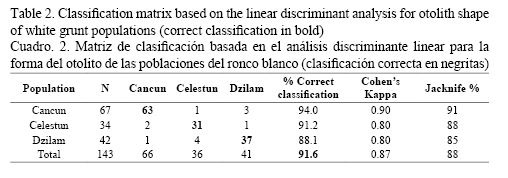
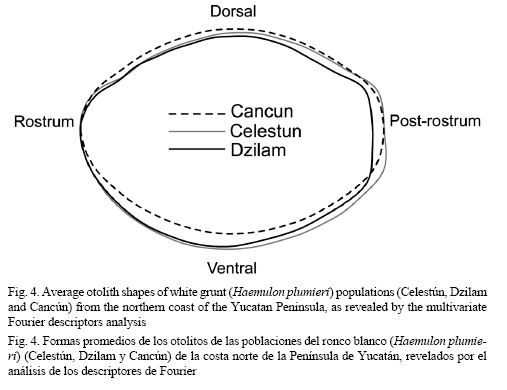
On the other hand, the non-parametric generalized discriminant analysis further supported differences among white grunt populations. In this latter analysis two statistically significant (P < 0.05) discriminant functions were generated (Fig. 3), which accounted for 100% of the total variation among groups (stocks). The classification success of the discriminant analysis (Table 2) indicated a strong separation between white grunt stocks, where the F-test associated to Wilk’s Lambda is highly significant (λ = 0.1588, F (96, 186) = 2.9231, P < 0.0000). The classification matrix generated by the non-parametric generalized discriminant analysis showed that from the 143 samples used to adjust the discriminant model, 131 (91.61%) were classified correctly (Table 2), and results from both jackknife cross-validation and Cohen’s kappa statistics confirmed the relatively high rates of classification success obtained by the discriminant analysis. The overall correct classification jackknife percentage (88%) and Cohen’s kappa coefficient (κ = 0.87) indicated that the classification efficiency was 87-88% better than it would have occurred by chance alone (Table 2). Finally, the Mahalanobis squared distance test (D2) showed that the centroids for the Celestún and Dzilam white grunt populations were the most distant (D2 = 11.051), while the Dzilam and Cancún populations were closest (D2 = 8.410) (Fig. 3). To visualize differences in average shapes, the reproduced outlines of the mean Fourier descriptors (harmonics) by population were plotted as overlay picture and are shown in Fig. 4. Overall, the highest between-population otolith shape variation clearly occurs especially in the ventral and post-rostrum parts of the otolith (Fig. 4). These mean otolith outlines support the differences observed by the PERMANOVA and the discriminant analysis.
DISCUSSION
The otolith shape analysis of white grunt populations in the northern coast of the Yucatan Peninsula showed discrimination among 3 sampling populations with the PERMANOVA and the discriminant analysis. All pairwise comparisons from the PERMANOVA indicated significant differences in otolith shapes among stocks. Discriminant analysis results support such differences among stocks because on average more than 91% of individuals were correctly classified within each group. According to Friedland & Reddin (1994), more than 75% classification success is needed to consider this otolith Fourier shape analysis as an acceptable phenotypic discrimination tool. In this study 87% to 88% of white grunt specimens were correctly classified within each population, suggesting that the otolith shape variation analysis could be an acceptable tool for regional population discrimination for this species on the northern coast of the Yucatan Peninsula.
The distribution of white grunt in the northern coast of the Yucatan Peninsula suggests that these differential stocks apparently inhabit distinct locations within the distribution area of this species. It is generally assumed that individuals that encounter the same kind of environmental conditions present otoliths with the same patterns in growth and, consequently, in shape. Campana & Casselman (1993) suggested that environmental effects are generally more influential determinants of otolith shape, as otolith shape changes in response to differences in growth rate. In this sense, apparently the degree of discrimination from the otolith shape analysis indicated that the white grunt population on the northern coast of the Yucatan Peninsula is probably composed of 3 stocks geographically separated from each other (Celestún, Dzilam and Cancún). Therefore, the otolith Fourier shape analysis is likely to be a suitable parameter for discriminating the three components of the white grunt population from the northern coast of the Yucatan Peninsula. It has been suggested that the main causes for otolith shape variation among far apart populations are both genetic and environmental differences (Castonguay et al. 1991; Friedland & Reddin, 1994). Although there is a genetic influence in the otolith growth (Swain et al. 2005), differences in external shapes of these structures might also be influenced by differential growth rates of individuals from each stock unit that inhabits areas with different environmental conditions as it has been mentioned by other authors (Campana & Casselman, 1993; Stransky et al. 2008; Vignon & Morat, 2010). In this sense, Gauldie & Nelson (1990) found that growth rates had a direct link to otolith shape because faster growth usually produces longer and thinner otoliths, and some studies have also found that classification success from otolith shape increases as genetic discreteness or geographic separation increases (Castonguay et al. 1991; Friedland & Reddin, 1994; Burke et al. 2008; Vignon & Morat 2010), implying that genetic differences are the main reason for shape variation. However, phenotypic variation, i.e. otolith shape, among significantly different stock units may indeed provide an indirect basis of stock structure because they may be defined based on the existence of at least partial isolation (Begg & Waldman, 1999). It is well known that each otolith reflects significant differences in elemental concentrations of the environment where they have been observed (Chittaro et al. 2006). In the case of this study, differences between stocks suggest that the environmental conditions of each location were different. While Dzilam and Celestún are classified as estuarine, Cancún (also known as Chacmochuc) is a euryhaline coastal lagoon influenced by Caribbean waters (Herrera-Silveira, 2006). Fourier shape analysis provides for a fast, reliable and sustainable method to identify components of stock within a mixed fishery. This kind of stock discrimination method using the Fourier shape analysis is less time consuming and has lower running costs than genotypic approaches such as DNA microsatellites or otolith microstructure and microchemical analysis for different populations (Chittaro et al. 2006), such as age determination.
The elliptical Fourier analysis used in this study has proven to be the most powerful and appropriate method for otolith shape analysis since it can capture the entire shape variation and small-scale individual differences on the otolith outline (Campana & Casselman, 1993). The method presented here, based on interpopulation differences in elliptic Fourier amplitudes, shows its potential to discriminate stock or population components.
Overall this study indicated that there was considerable variability in the otolith shape of white grunt providing useful information that allowed for separate fish collected from different sites. This study may represent the first to use this kind of otolith shape analysis to discriminate stock components of the white grunt around its distribution range; although this kind of geographic variation in otolith shape has also been identified at different spatial scales among different stocks of several fish species (Castonguay et al. 1991; Campana & Casselman, 1993; Friedland & Reddin, 1994; Begg & Brown, 2000; Stransky et al. 2008), more studies such as microchemistry, isotopes, and molecular tools are needed to support even more the usefulness of otolith shape as a stock discrimination tool.
ACKNOWLEDGEMENTS
We thank Consejo Nacional de Ciencia y Tecnología (CONACYT) for the postgraduate studentship granted to H.V.H. (Grant 290541). Special thanks to all members of Laboratorio de Biología Marina from Universidad Autónoma de Yucatán (UADY) for their advice and technical support. This study was partially financed by Consejo Nacional de Ciencia y Tecnología (CONACYT) and Universidad Autónoma de Yucatán (UADY).
REFERENCES
Abaunza, P., Murta, A. G., Campbell, N., Cimmaruta, R., Comesaña, A. S., Dahle, G., García-Santamaría, M. T., Gordo, L. S., Iversen, S. A., MacKenzie, K., Magoulas, A., Mattiucci, S., Molloy, J., Nascetti, G., Pinto, A. L., Quinta, R., Ramos, P., Sanjuan, A., Santos, A. T., Stransky, C. & Zimmermann, C. (2008). Stock identity of horse mackerel (Trachurus trachurus) in the Northeast Atlantic and Mediterranean Sea: Integrating the results from different stock identification approaches. Fish. Res., 89(2), 196-209.
Anderson, M. J. (2001). A new method for non-parametric multivariate analysis of variance. Austral Ecol., 26, 32-46.
Anderson, M. J. (2005). PERMANOVA Permutational multivariate analysis of variance. Auckland, New Zealand: Department of Statistics, University of Auckland.
Anderson, M. J. & Robinson, J. (2003). Generalised discriminant analysis based on distances. Aust. Nz. J. Stat., 45(3), 301-318.
Begg, G. A. & Waldman, J. R. (1999). An holistic approach to fish stock identification. Fish. Res., 43(1-3), 35-44.
Begg, G. A. & Brown, R. W. (2000). Stock identification of haddock Melanogrammus aeglefinus on Georges Bank based on otolith shape analysis. Trans. Am. Fish. Soc., 129(4), 935-945.
Burke, N., Brophy, D. & King, P. A. (2008). Otolith shape analysis: its application for discriminating between stocks of Irish Sea and Celtic Sea herring (Clupea harengus) in the Irish Sea. ICES J. Mar. Sci., 65(9), 1670-1675.
Cadrin, S. X., Friedland, K. D. & Waldman, J. R. (2005). Stock identification methods: applications in fishery science. Oxford, United Kingdom: Elsevier Academic Press.
Campana, S. E. & Casselman, J. M. (1993). Stock discrimination using otolith shape analysis. Can. J. Fish. Aquat. Sci., 50(5), 1062-1083.
Cardinale, M., Doering-Arjes, P., Kastowsky, M. & Mosegaard, H. (2004). Effects of sex, stock, and environment on the shape of known-age Atlantic cod (Gadus morhua) otoliths. Can. J. Fish. Aquat. Sci., 61(2), 158-167.
Casselman, J. M., Collins, J. J., Crossman, E. J., Ihssen, P. E. & Spangler, G. R. (1981). Lake whitefish (Coregonus clupeaformis) stocks of the Ontario waters of Lake Huron. Can. J. Fish. Aquat. Sci., 38(12), 1772-1789.
Castonguay, M., Simard, P. & Gagnon, P. (1991). Usefulness of Fourier analysis of otolith shape for Atlantic mackerel (Scomber scombrus) stock discrimination. Can. J. Fish. Aquat. Sci., 48, 296-302.
Chittaro, P. M., Gagnon, J. & Fryer, B. J. (2006). The differentiation of Stegastes partitus populations using lapillar and sagittal otolith chemistry. J. Fish. Biol., 68(6), 1909-1917.
Clarke, K. R. (1993). Non-parametric multivariate analyses of changes in community structure. Aust. J. Ecol., 18(1), 177-143.
DeVries, D. A., Grimes, C. B. & Prager, M. H. (2002). Using otolith shape analysis to distinguish eastern Gulf of Mexico and Atlantic Ocean stocks of king mackerel. Fish. Res., 57, 51-62.
Friedland, K. D. & Reddin, D. G. (1994). Use of otolith morphology in stock discriminations of Atlantic salmon (Salmo salar). Can. J. Fish. Aquat. Sci., 51, 91-98.
Gauldie, R. W. & Nelson, D. G. A. (1990). Otolith growth in fishes. Comp. Biochem. Phys. A., 97(2), 119-135.
González-Salas, C. & Lenfant, P. (2007). Inter-annual variability and intra-annual stability of the otolith shape in European anchovy Engraulis encrasicolus L. in the Bay of Biscay. J. Fish. Biol., 70, 35-49.
Herrera-Silveira, J. A. (2006). Lagunas costeras de Yucatán (SE, México): investigación, diagnóstico y manejo. Ecotropicos., 19(2), 94-108.
Ihssen, P. E., Booke, H. E., Casselman, J. M., McGlade, J. M., Payne, N. R. & Utter, F. M. (1981). Stock identification: materials and methods. Can. J. Fish. Aquat. Sci., 38, 1838-1855.
Iwata, H. & Ukai, Y. (2002). Shape: A computer program package for quantitative evaluation of biological shapes based on elliptic Fourier descriptors. J. Hered., 93(5), 384-385.
Jones, M. E. & Barber, P. H. (2005). Characterization of microsatellite loci for the detection of temporal genetic shifts within a single cohort of the brown demoiselle, Neopomacentrus filamentosus. Mol. Ecol. Notes, 5(4), 834-836.
Kuhl, F. P. & Giardina, C. R. (1982). Elliptic Fourier features of a closed contour. Comput. Vision Graph., 18(3), 236-258.
Lindeman, K. C. (1986). Development of larvae of the French grunt, Haemulon flavolineatum, and comparative development of twelve species of western Atlantic Haemulon (Percoidei, Haemulidae). Bull. Mar. Sci., 39(3), 673-716.
Lindeman, K. C. & Toxey, C. S. (2002). Haemulidae: Grunts. In K. E. Carpenter (Ed.), The living marine resources of the Western Central Atlantic (pp. 1522-1529). Rome, Italy: FAO.
Mahalanobis, P. C. (1936). On the generalized distance in statistics. Proc. Nat. Inst. Sci. India, 12, 49-55.
McQuinn, I. H. (1997). Metapopulations and the Atlantic herring. Rev. Fish. Biol. Fish., 7(3), 297-329.
Mosegaard, H. & Madsen, K. P. (1996, September). Discrimination of mixed herring stocks in the North Sea using vertebral counts and otolith microstructure. Conference presented in the International Council for Exploration of the Sea, Reykjavik, Iceland.
Palazón-Fernández, J. L. (2007). Reproduction of the white grunt, Haemulon plumieri (Lacépede, 1802) (Pisces: Haemulidae) from Margarita Island, Venezuela. Sci. Mar., 71(3), 429-440.
Pothin, K., González-Salas, C., Chabanet, P. & Lecomte-Finiger, R. (2006). Distinction between Mulloidichthys flavolineatus juveniles from Reunion Island and Mauritius Island (south-west Indian Ocean) based on otolith morphometrics. J. Fish. Biol., 69(1), 38-53.
Renaud, S., Michaux, J., Jeager, J. J. & Auffray, C. (1996). Fourier analysis applied to Stephanomys (Rodentia: Muridae) molars: nonprogresive evolutionary pattern in a gradual lineage. Paleobiology, 22(2), 255-265.
Rice, W. R. (1989). Analyzing tables of statistical tests. Evolution, 43, 223-225.
SAGARPA (Secretaría de Agricultura, Ganadería, Desarrollo Rural, Pesca y Alimentación). (2006). Carta nacional pesquera. In A. López González (Ed.), Diario Oficial de la Federación, Tomo DCXXXV 19 (2nd. section) (pp. 1-128). Ciudad de México, Mexico, D. F.: CONAPESCA, SAGARPA.
Secor, D. H., Dean, J. M. & Laban, E. H. (1992). Otolith removal and preparation for microstructural examination. Can. Spec. Publ. Fish. Aquat. Sci., 117, 19-57.
Stransky, C. (2005). Geographic variation of golden redfish (Sebastes marinus) and deep-sea redfish (S. mentella) in the North Atlantic based on otolith shape analysis. ICES J. Mar. Sci., 62(8), 1691-1698.
Stransky, C., Murta, A. G., Schlickeisen, J. & Zimmermann, C. (2008). Otolith shape analysis as a tool for stock separation of horse mackerel (Trachurus trachurus) in the Northeast Atlantic and Mediterranean. Fish. Res., 89(2), 159-166.
Swain, D. P., Hutchings, J. A. & Foote, C. J. (2005). Environmental and genetic influence on stock identification characters. In S. X. Cadrin, K. D. Friedland & J. R. Waldman (Eds.), Stock Identification Methods (pp. 45-85). New York, USA: Elsevier Academic Press.
Titus, K., Mosher, J. A. & Williams, B. K. (1984). Chance-corrected classification for use in discriminate analysis: ecological applications. Am. Midl. Nat., 111(1), 1-7.
Vignon, M. & Morat, F. (2010). Environmental and genetic determinant of otolith shape revealed by a non-indigenous tropical fish. Mar. Ecol. Prog. Ser., 411, 231-241.
Villegas-Hernández, H., González-Salas, C., Aguilar-Perera, A. & López-Gómez, M. J. (2008). Settlement dynamics of the coral reef fish Stegastes partitus, inferred from otolith shape and microstructure analysis. Aquat. Biol., 1, 249-258.